Bitcoin: seven red weeks in a row. How did such streaks end in the past?
OKX weekly candles: streaks of 4+ red weeks since 2021, the longest at 9 weeks. The current streak and what to learn from it.
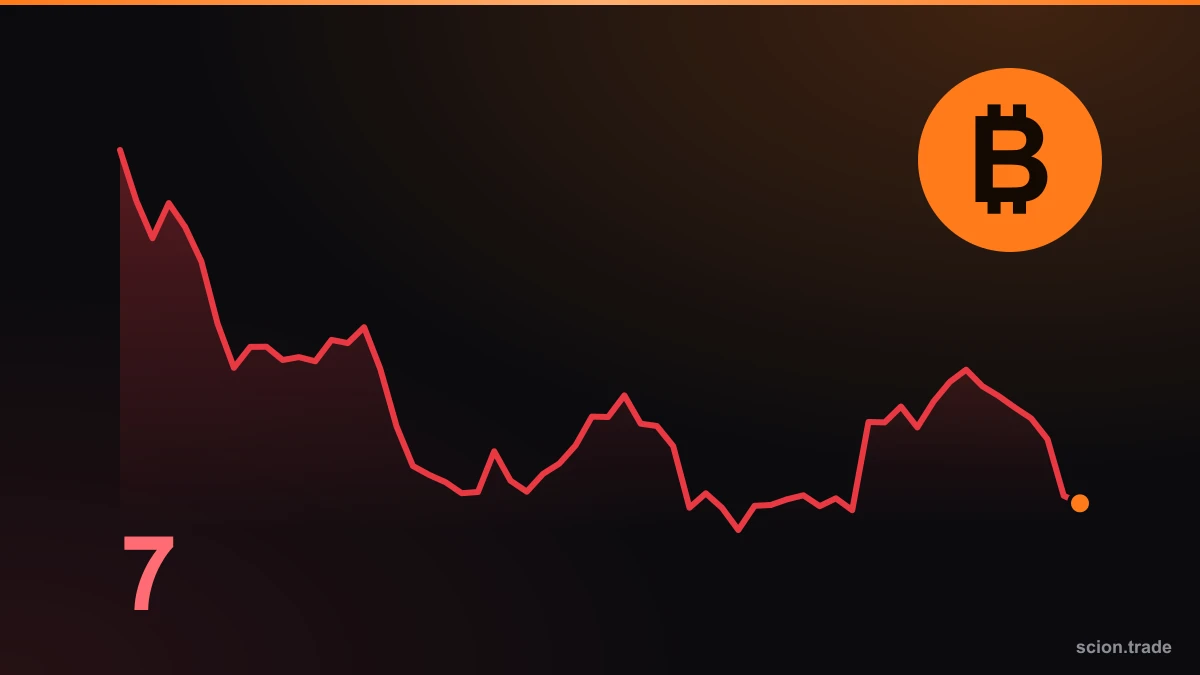
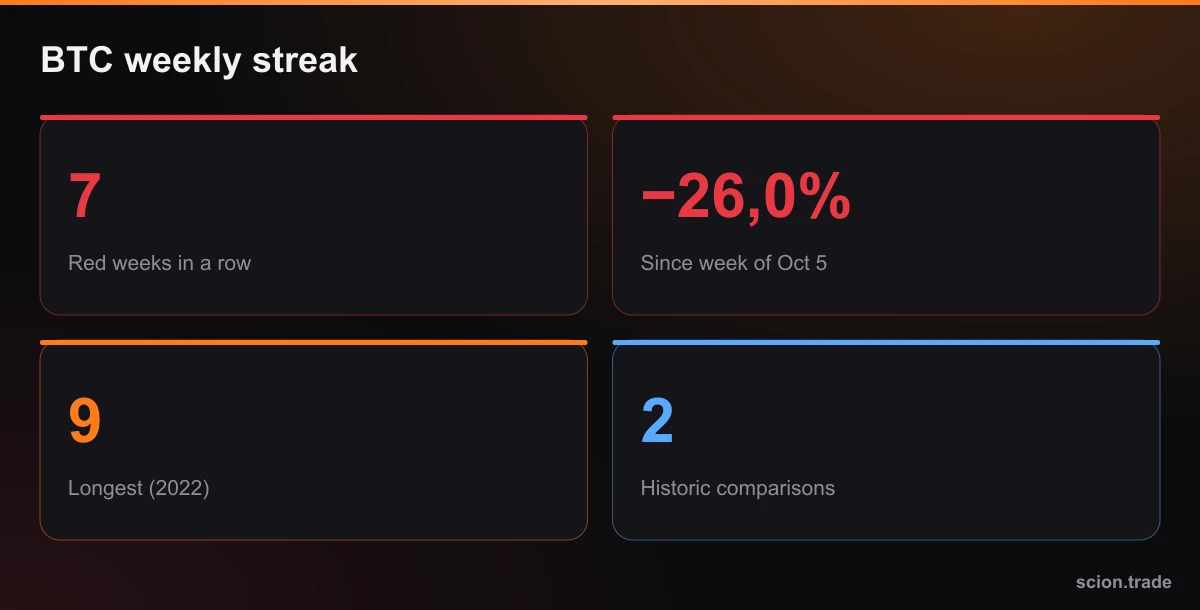
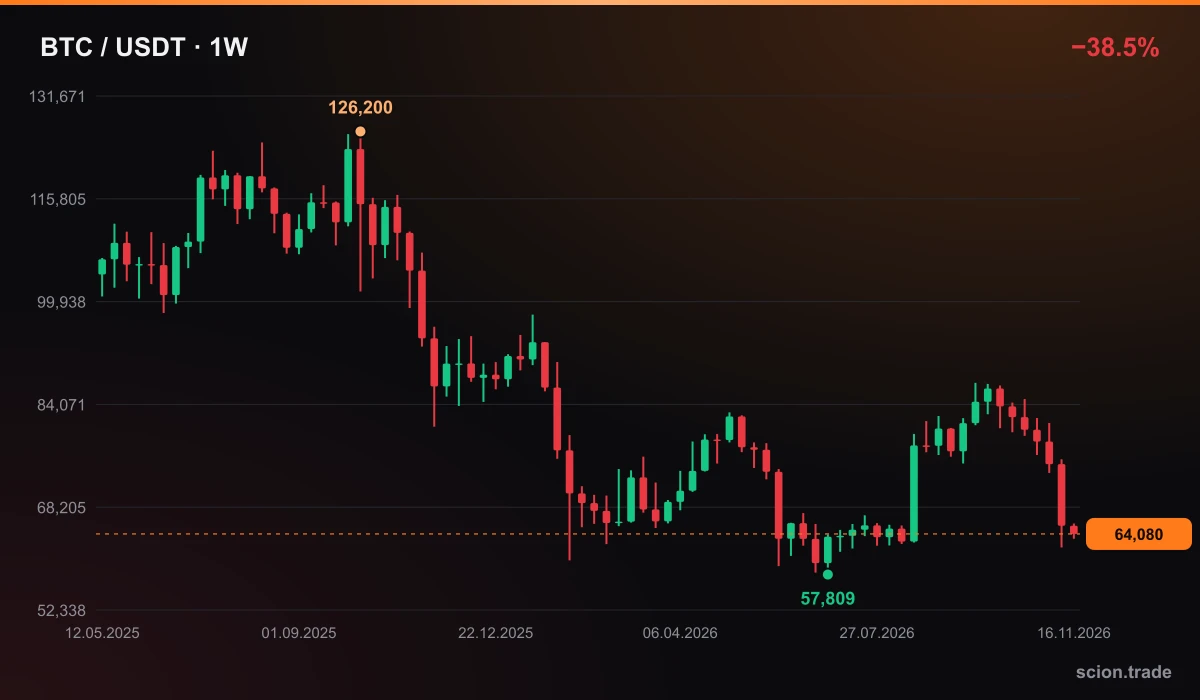
Bitcoin's weekly candles have been red for seven weeks in a row (OKX, UTC weeks: from the week of Oct 5 to the current one, which has not closed yet). Over that time price fell from $86,522 (the open of the week of Oct 5) to $64,063, about −26.0%. Let us look at the past within the same data frame.
Method
I checked 300 weekly BTC/USDT candles on OKX going back to February 2021. A "red week" means close < open. I counted only streaks of 4 or more consecutive red weeks.
Streaks in history
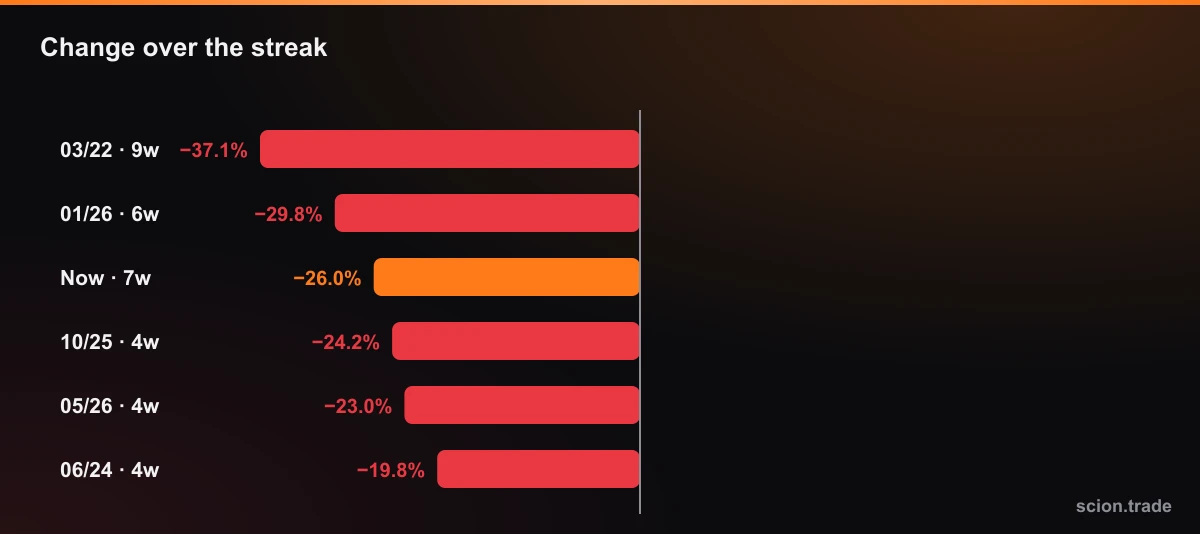
- Mar–May 2022: 9 weeks, −37.1% (longest in this sample).
- Jan–Feb 2026: 6 weeks, −29.8%.
- Oct–Nov 2025: 4 weeks, −24.2%.
- May–Jun 2026: 4 weeks, −23.0%.
- Jun 2024: 4 weeks, −19.8%.
- 2023 and Apr 2024: 4 weeks each, roughly −11.5% to −11.8%.
The current streak (7 weeks, −26.0%) is the second longest in the sample after 2022.
What happened after
The result 4 weeks after the sixth or seventh red week:
- In 2022: −12.1% after week 6 and −15.2% after week 7.
- In Feb 2026: +0.4% after week 6.
That is only two episodes, and they happened in different macro backdrops. Conclusion: the streak itself is not a reversal signal, and the sample is too small for statistics.
What should we learn
- A streak does not mean "exhaustion". Red weeks can be independent of each other; thinking price "should not fall anymore" is the gambler's fallacy.
- Context decides. 2022 was a hiking cycle; today the market is also pricing a rate hike.
- The week has not closed. The current weekly candle closes on Sunday night UTC; the streak can change until then.
- Have a plan. However long the streak, position size and stop must be calculated in advance.
Source: OKX API (candles), calculations are ours.
This material is for educational purposes only and is not investment advice.