Support and resistance: how to draw levels
Finding important levels on a chart and judging breakouts properly.
The idea
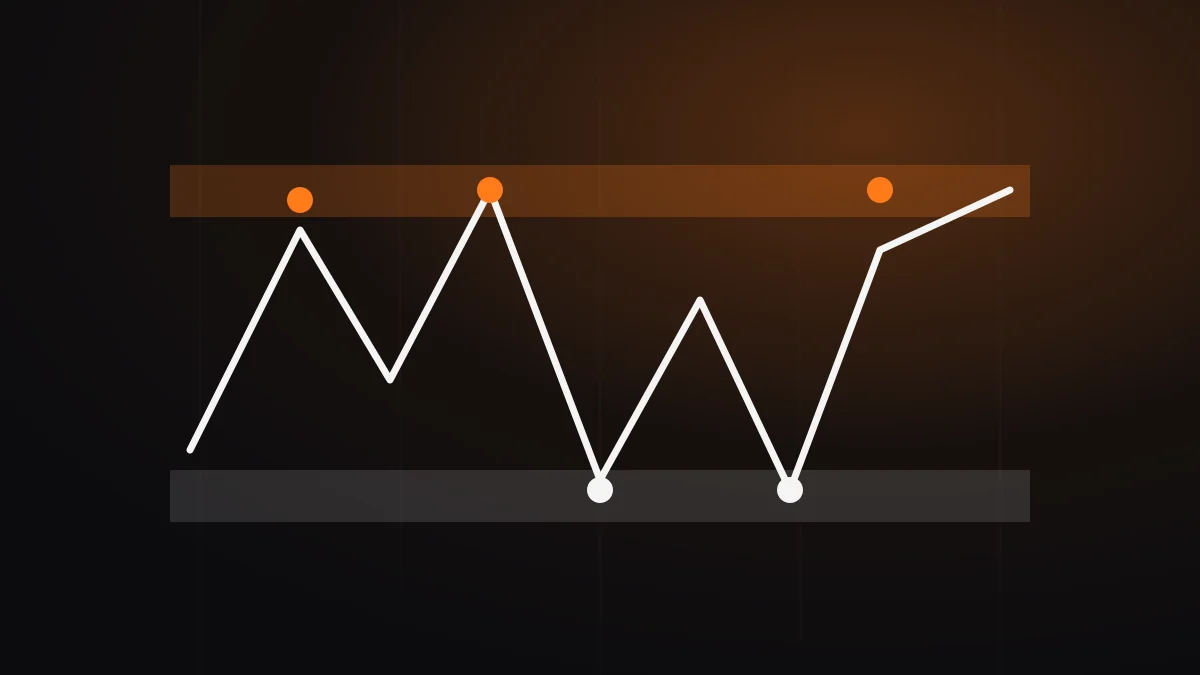
Support is a zone where price has stopped falling before, and resistance is where it has stopped rising.
How to draw them
- Start with a higher timeframe, such as the daily chart.
- Find places where price has reacted several times.
- Mark a zone rather than an exact line.
Role reversal
Broken resistance sometimes becomes support, and broken support becomes resistance.
False breakouts
Price can pass a level and quickly return. Waiting for the candle close and checking volume can reduce this risk, but will not remove it.
This material is for educational purposes only and is not investment advice.