What is RSI? Daily RSI at 23: what does "oversold" really mean?
Bitcoin's daily RSI is around 23. Learn how RSI is calculated, where the 30/70 rule fails and how to use it properly.
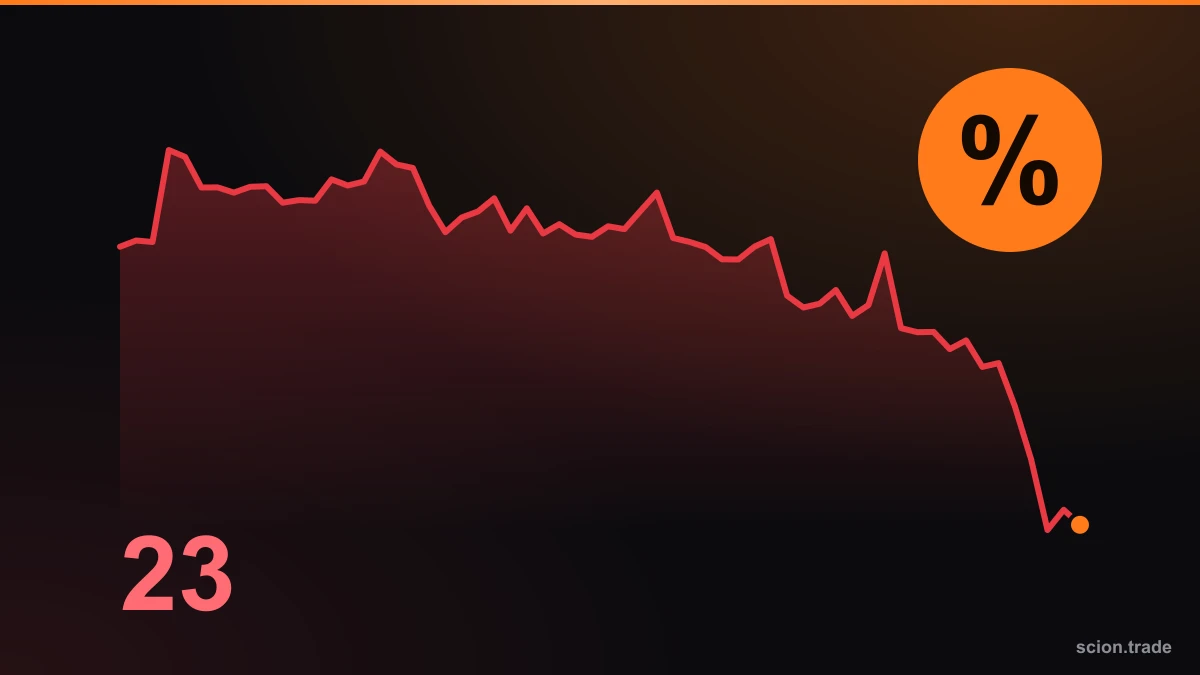
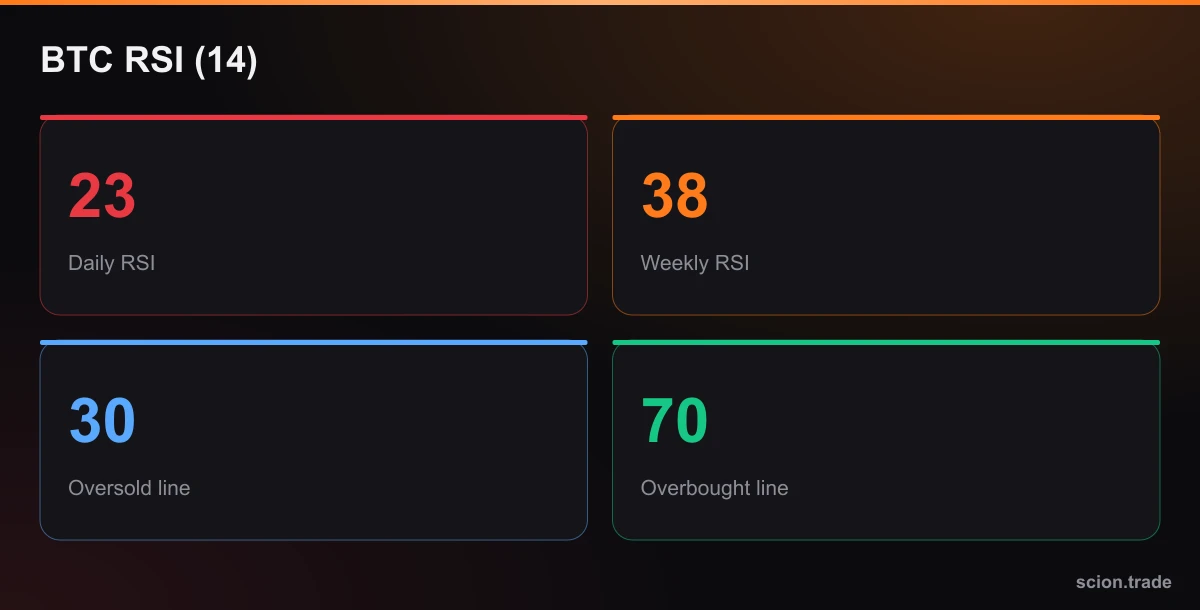
According to FXStreet, Bitcoin's daily RSI is about 23 and the weekly RSI is 38. Analysts call this "oversold". But what is RSI, and does that word really mean "time to buy"?
What is RSI?
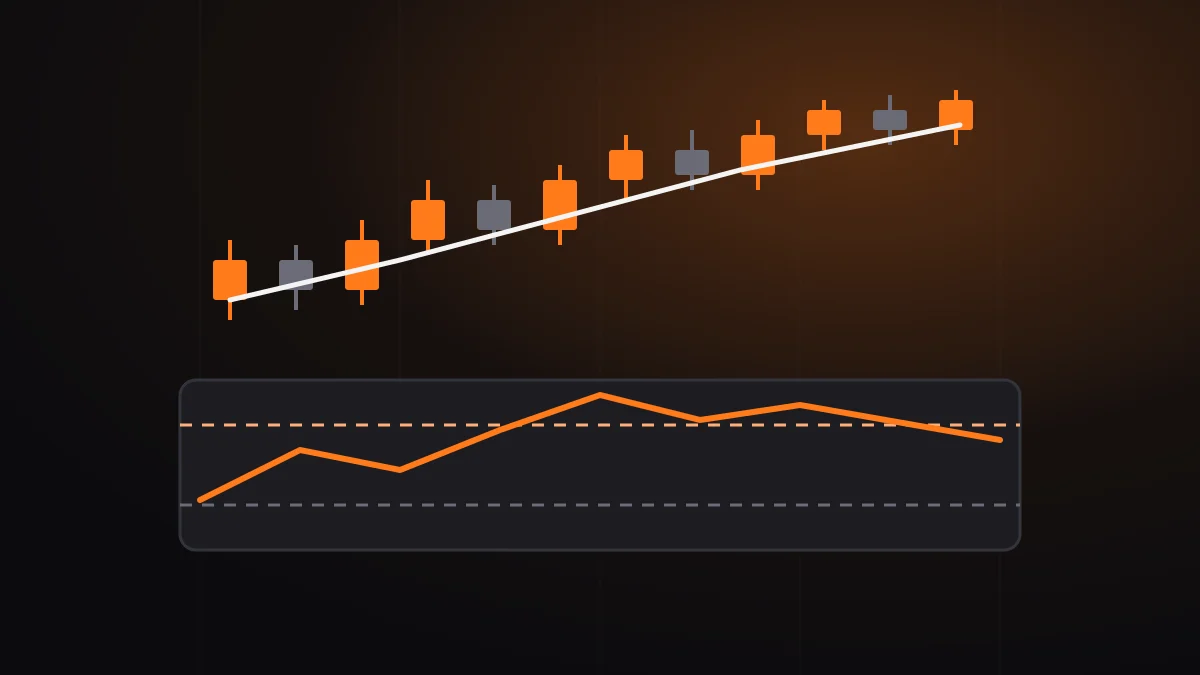
RSI (Relative Strength Index) is a momentum indicator that shows, on a 0–100 scale, the ratio of gains to losses over the last N candles (usually 14).
- Average gain ÷ average loss = RS
- RSI = 100 − 100 ÷ (1 + RS)
If all recent candles are red, RSI approaches 0; if all are green, 100.
Classic rules
- Above 70: overbought.
- Below 30: oversold.
- 50: neutral line; hints at trend direction.
The big mistake: "oversold = buy"
RSI measures how fast price moved, not that direction will reverse. In a strong downtrend RSI can stay below 30 for weeks. A reading of 23 only says the recent drop was very sharp and the odds of a short-term relief bounce rose. FXStreet also notes that trend-following models are not yet signalling a reversal.
How to use RSI properly
- Read it with the trend. In a downtrend, oversold signals often mean only a small bounce.
- Use multiple timeframes: daily 23, weekly 38: daily is weak, weekly not yet extreme.
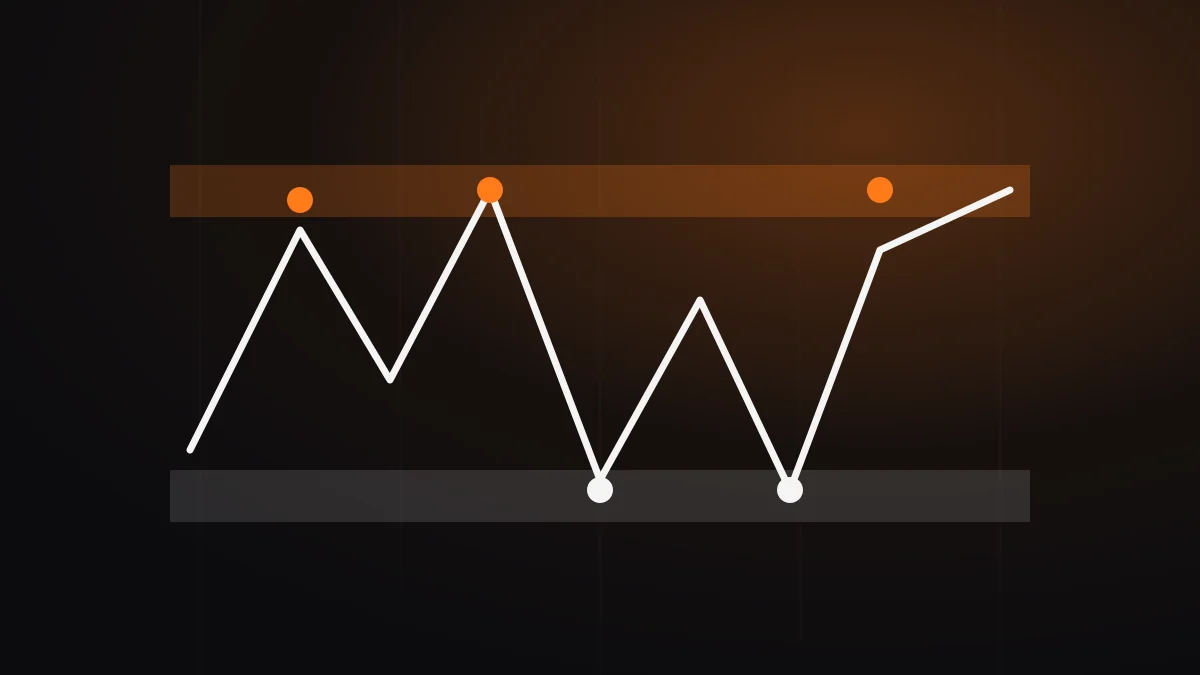
- Look for divergence: if price makes a new low but RSI makes a higher low, selling pressure may be fading. That is a hint, not a confirmation.
- Combine with levels: support, volume and liquidation data.
- Risk plan: however good a signal looks, calculate position size in advance.
Example
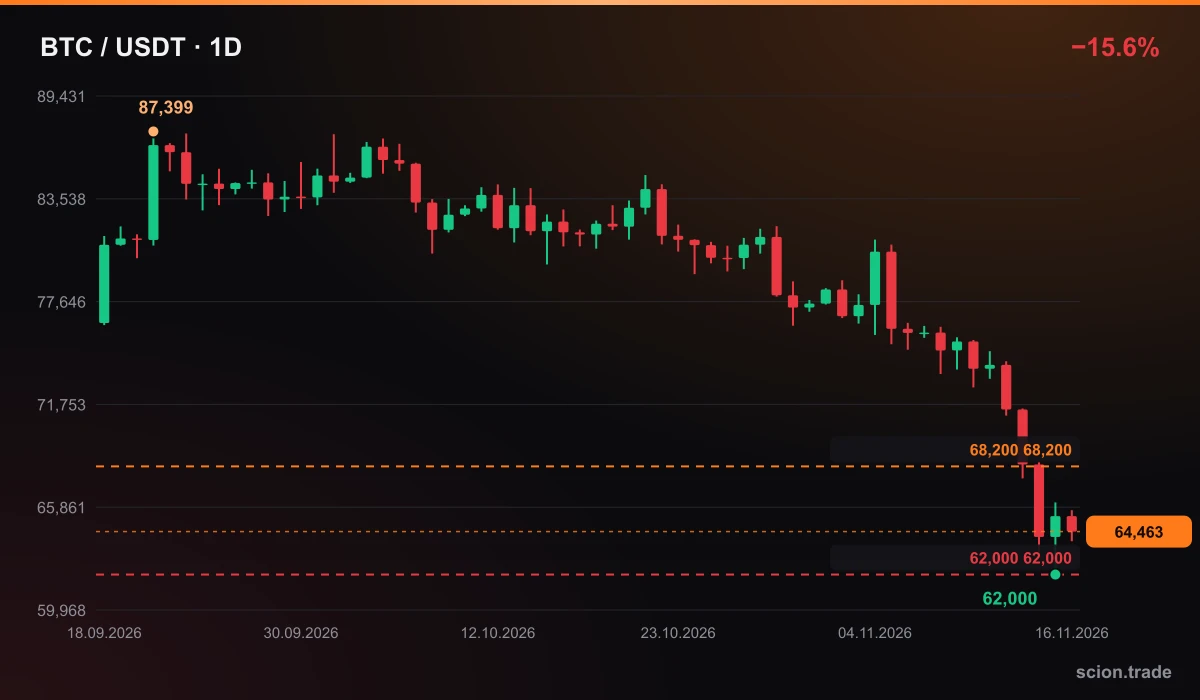
Since Nov 5 BTC has fallen from about $76,000 to $62,000 (OKX). That fast drop pulled RSI down. What happens next depends less on RSI and more on whether price can reclaim levels like $65,600 and $68,200.
Sources: FXStreet, prices and chart: OKX API.
This material is for educational purposes only and is not investment advice.