Candlestick charts: what does a candle tell you?
Open, close and wicks explained, plus three well-known candle patterns.
Anatomy of a candle
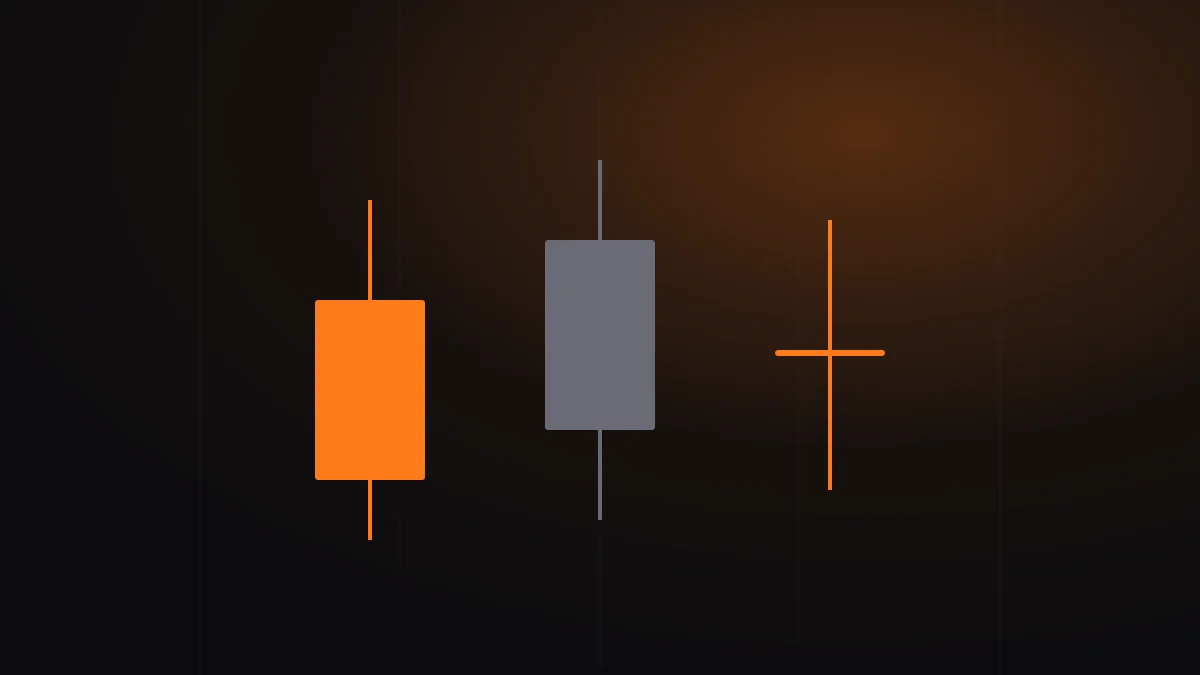
Each candle shows four prices for the period: open, close, high and low. The body sits between open and close, and the wicks mark the extremes.
Three well-known patterns
- Doji: open and close are close together, showing indecision.
- Hammer: a long lower wick shows that selling lower down was bought back.
- Engulfing: a large body fully covers the previous candle.
Using them well
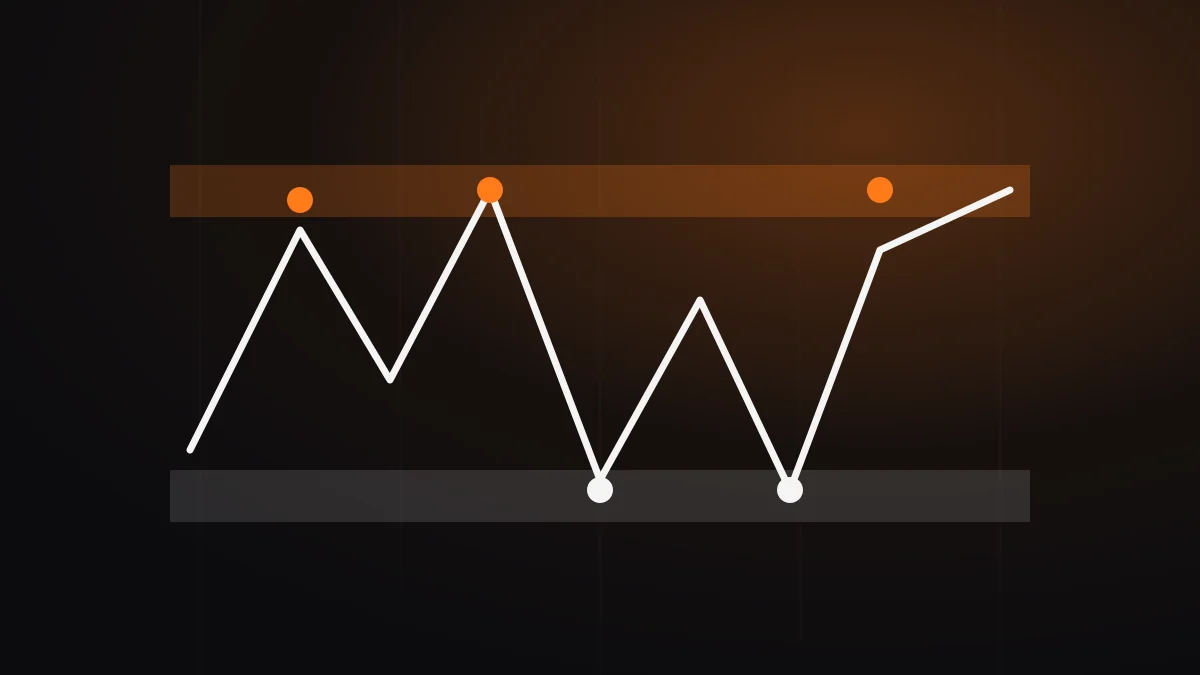
A pattern gets its value from where it forms: at support, at resistance or at the end of a trend. Wait for the candle to close, because a forming candle can change. A single candle never guarantees an outcome.
This material is for educational purposes only and is not investment advice.