RSI and moving averages: how to use them well
What these two popular indicators show and the most common mistakes.
RSI
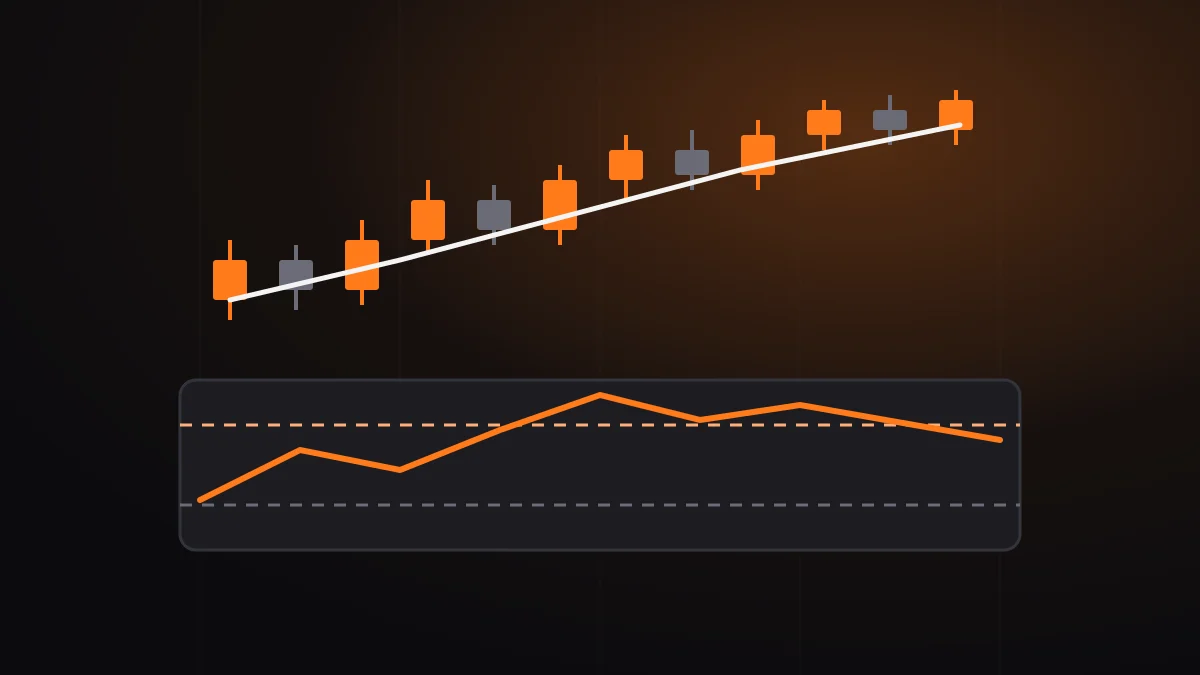
RSI measures the speed of price moves on a scale of 0–100. A 14-period setting is common. Above 70 is considered overbought and below 30 oversold.
In a strong trend RSI can stay in these zones for a long time, so 70 is not an automatic sell signal.
Moving averages
A moving average smooths price and helps show the trend. An EMA gives more weight to recent prices. The 20, 50 and 200 period averages are widely watched.
Common mistakes
- Stacking many similar indicators on one chart
- Forgetting the lag: averages are based on past prices
- Trusting crossovers in a sideways market
This material is for educational purposes only and is not investment advice.