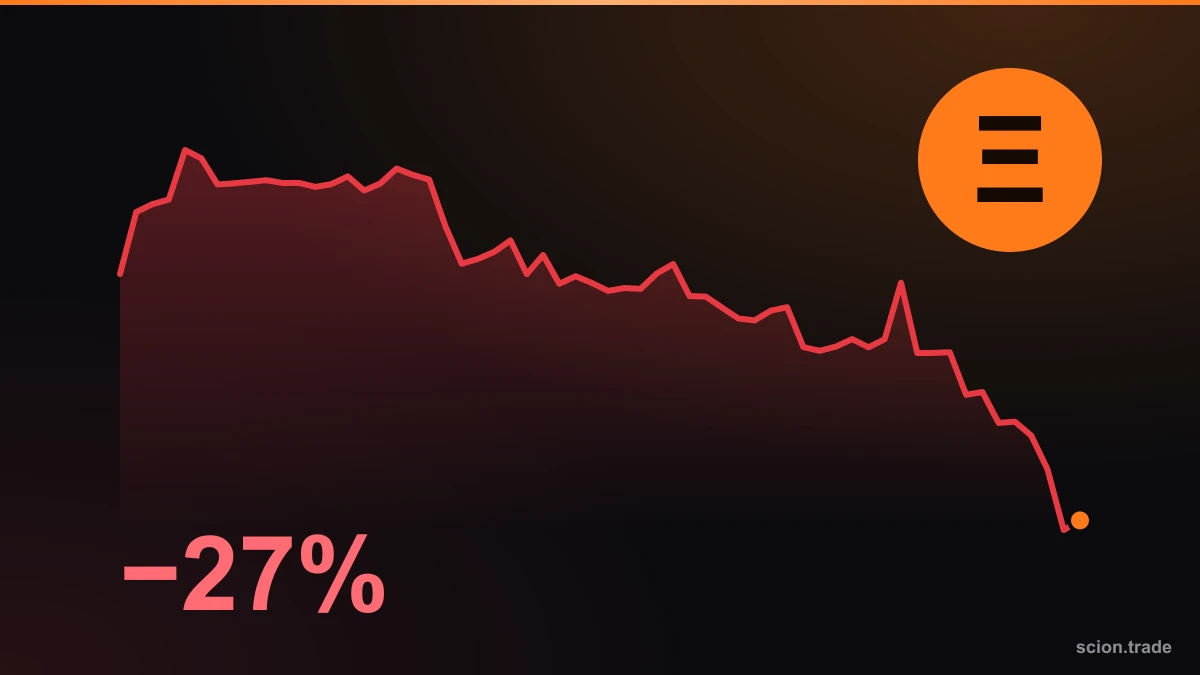
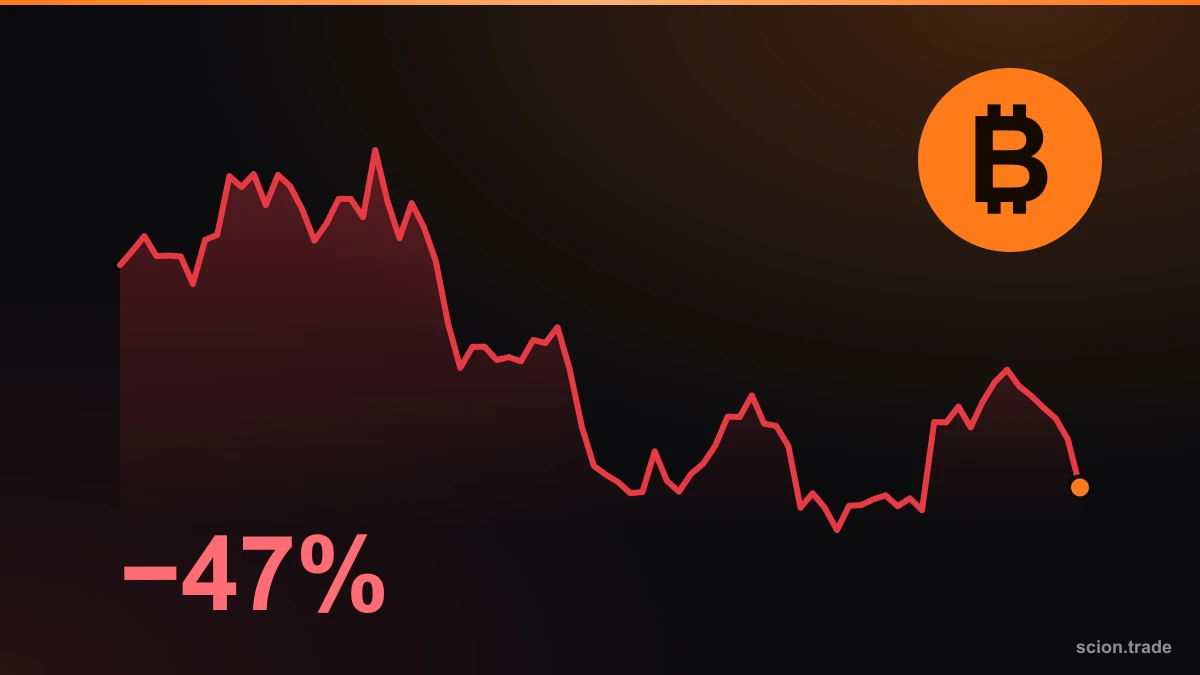
What is correlation? The Nasdaq rose 4% and bitcoin barely moved
The 30-day correlation between BTC and the Nasdaq 100 is 0.70, yet on 9 November the Nasdaq rose 4% while BTC gained only 0.7%. How to read correlation, where it misleads, and how to use it in risk management.
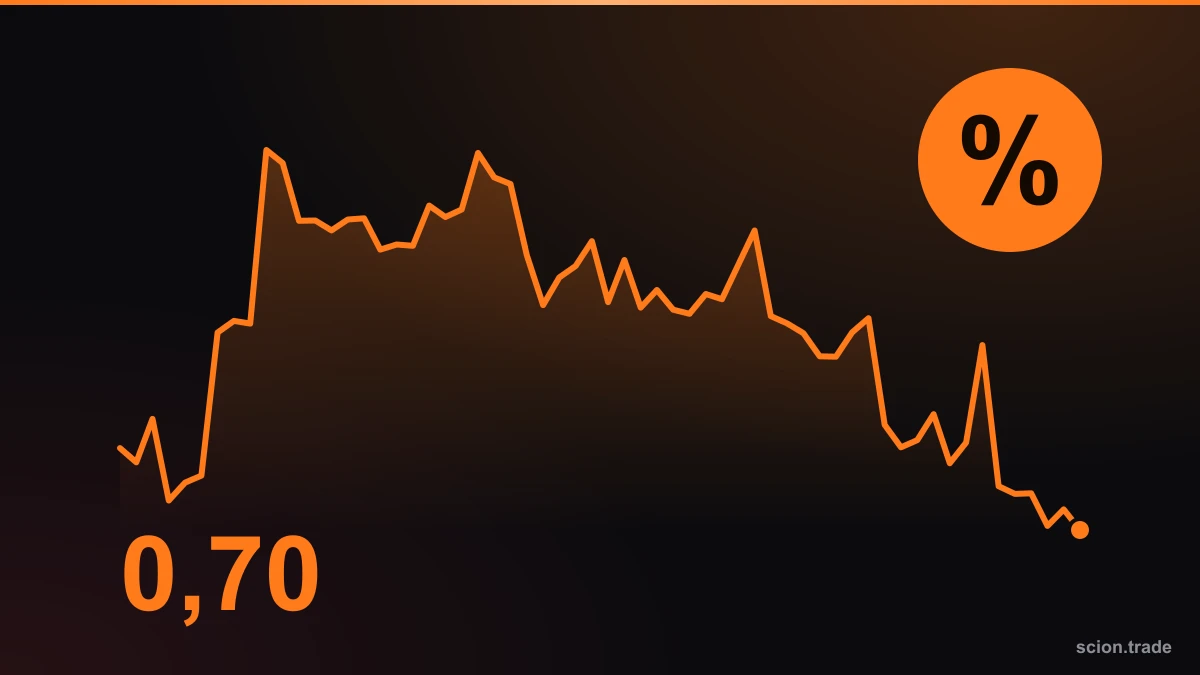
US stocks rallied hard on 9 November 2026: the Nasdaq 100 rose about 4%. Bitcoin gained only 0.7% that day. Yet over the last 30 days the correlation between BTC and the Nasdaq 100 is 0.70, which is high. So how does that happen? This article uses today's data to explain what correlation is, how it is calculated and what it does not tell you.
What is correlation?
Correlation measures how much two assets tend to move in the same direction. It ranges from −1 to +1:
- Near +1: they mostly rise and fall together.
- Around 0: no clear relationship.
- Near −1: when one rises, the other usually falls.
As a rule of thumb, above 0.5 is "strong", 0.2–0.5 is "weak to moderate" and below 0.2 is "weak".
How is it calculated?
Correlation is calculated on daily changes (returns), not on prices themselves. For example, you take the percentage change of BTC and the Nasdaq for each of the last 30 days and measure how closely the two series move together. The window moves forward one day every day, which is why it is called a rolling correlation.
Today's numbers
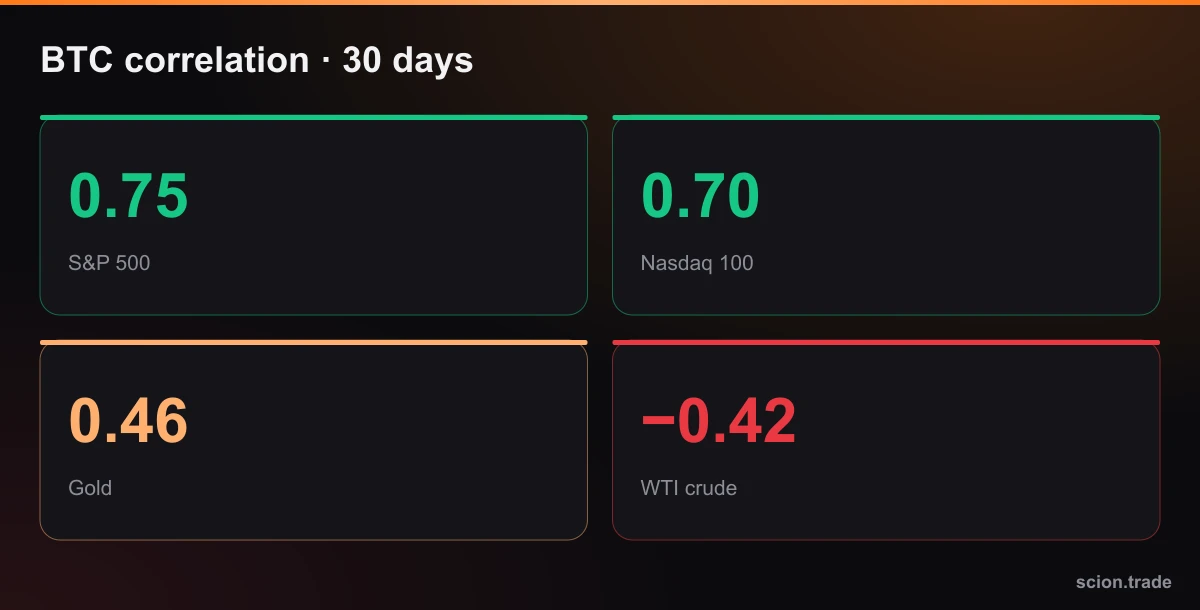
The 30-day correlation we calculated from Orderly and OKX daily data:
- BTC – S&P 500: 0.75
- BTC – Nasdaq 100: 0.70
- BTC – gold: 0.46
- BTC – WTI crude: −0.42
So right now bitcoin moves strongly with stocks, moderately with gold, and in the opposite direction to oil.
Correlation is not constant
The chart below shows how the BTC–Nasdaq correlation changed over the last 3 months. In late August and early September it was close to zero; from late September it climbed into the 0.6–0.7 range.
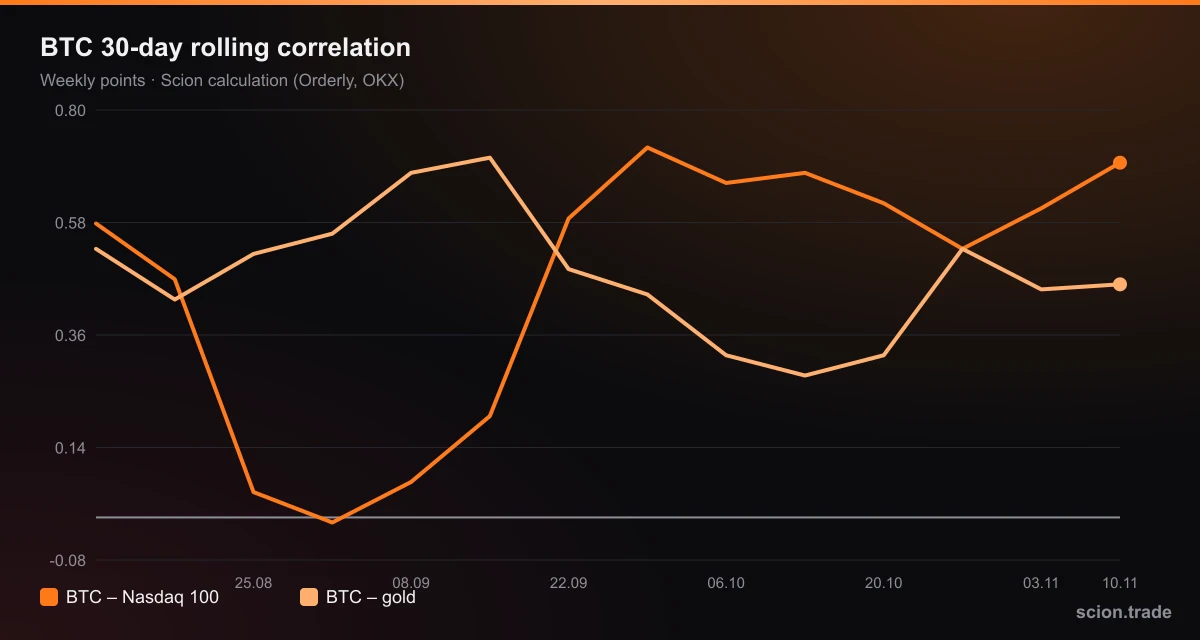
Lesson: yesterday's correlation is no guarantee for tomorrow. When the market regime changes, the relationship changes too.
High correlation, different day: 9 November
Correlation shows direction on average, not every single day. In recent days we saw two different pictures:
- 5 November: Nasdaq 100 −6.6%, BTC −5.5%. They fell together.
- 9 November: Nasdaq 100 +4.1%, BTC only +0.7%. BTC did not join the rally.
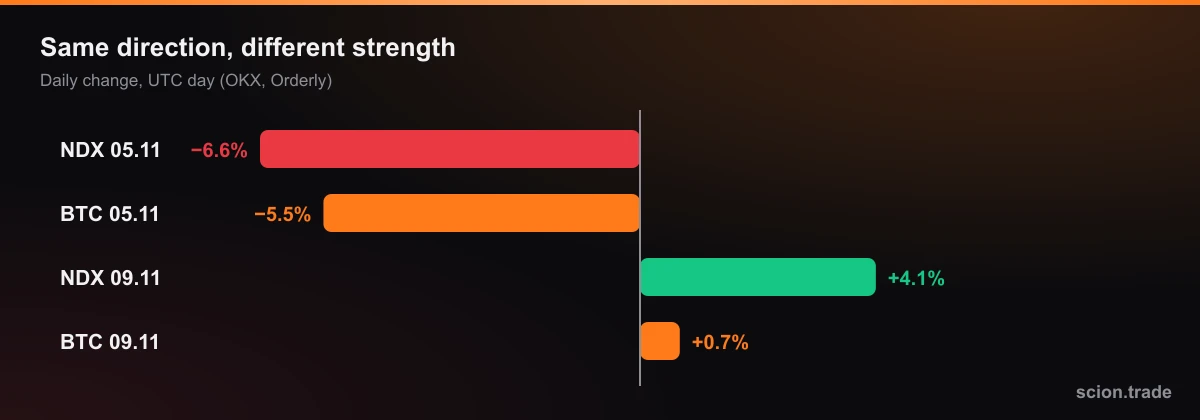
This asymmetry is an interesting signal: BTC falls with stocks but does not rise with them. The reason may be crypto-specific supply pressure: spot ETF outflows and miner selling. In that situation a high correlation number can hide bitcoin's weakness.
What correlation does not show
- Size of the move: a 0.70 correlation does not mean "if the Nasdaq rises 1%, BTC rises 1%". Size is measured by beta.
- Cause and effect: one does not move the other; often both react to the same driver (for example, rate expectations).
- The future: correlation is past data and can change quickly.
How can a trader use it?
- Spot hidden risk. If you are long both BTC and the Nasdaq while correlation is high, you are basically making the same bet twice. Size your total risk with our risk calculator.
- Watch the Nasdaq in the US session. With high correlation, the US open and macro data (today: CPI) also move BTC. Times are in our economic calendar.
- Watch for divergence. When BTC starts to move differently from stocks, look for the reason in crypto's own data: ETF flows, funding, open interest. You can follow them on our markets page.
Sources: correlation calculated by Scion (daily closes of Orderly PERP_NAS100, PERP_SPX500, PERP_XAU, PERP_CL and OKX BTC-USDT, UTC); 9 November market recap Benzinga; ETF flows Farside.
This material is for educational purposes only and is not investment advice.