What is drawdown? The maths of falling and recovering (BTC example)
An asset that falls 47% must rise 89% to return to its old peak. We explain drawdown with Bitcoin's current numbers.
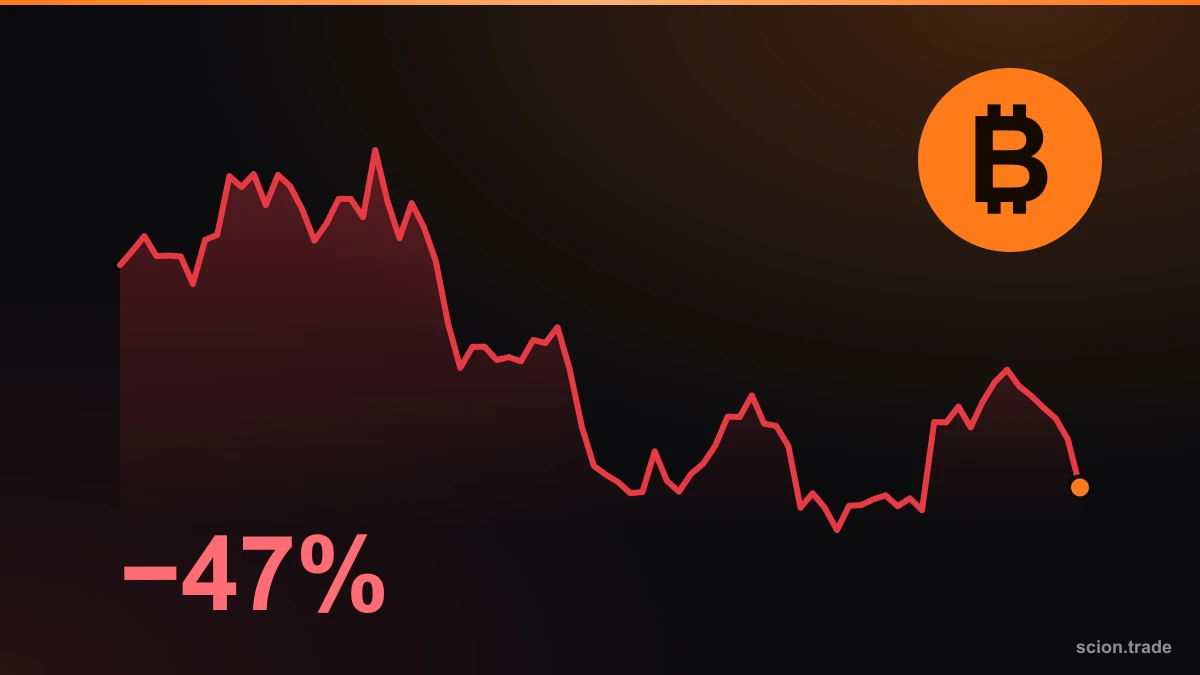
Drawdown shows how many percent the price is below its previous peak. It is one of the key ideas in risk management because the gain needed to recover a loss is always larger than the loss itself.
The BTC example
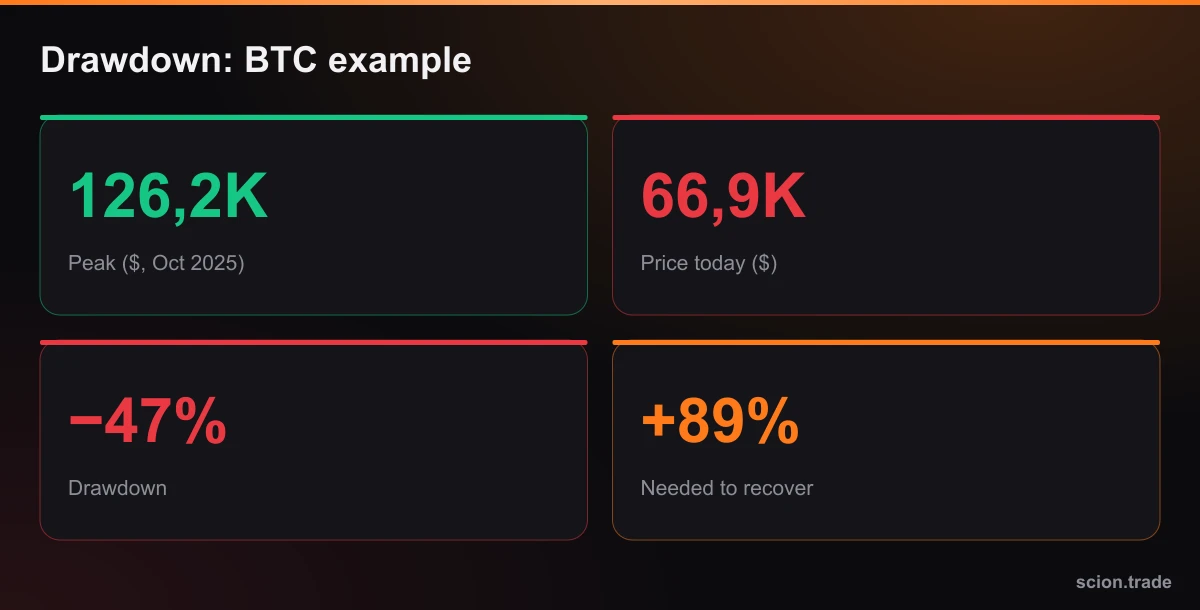
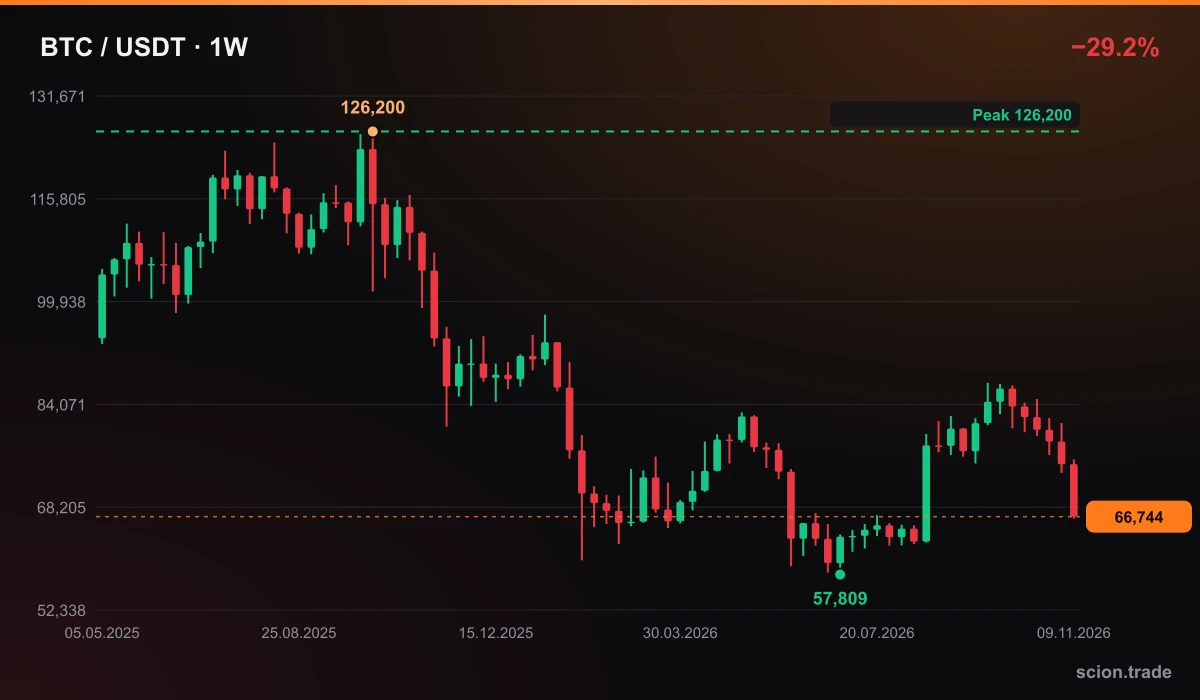
Bitcoin's highest weekly peak on OKX was $126,200 in October 2025. Today the price is about $66,900 (CryptoTicker). Drawdown: 66,900 / 126,200 − 1 ≈ −47%. To get back to the peak the price has to rise by about 89%. CryptoTicker notes BTC is about 23% below its level at the start of the year ($87,575).
The formula
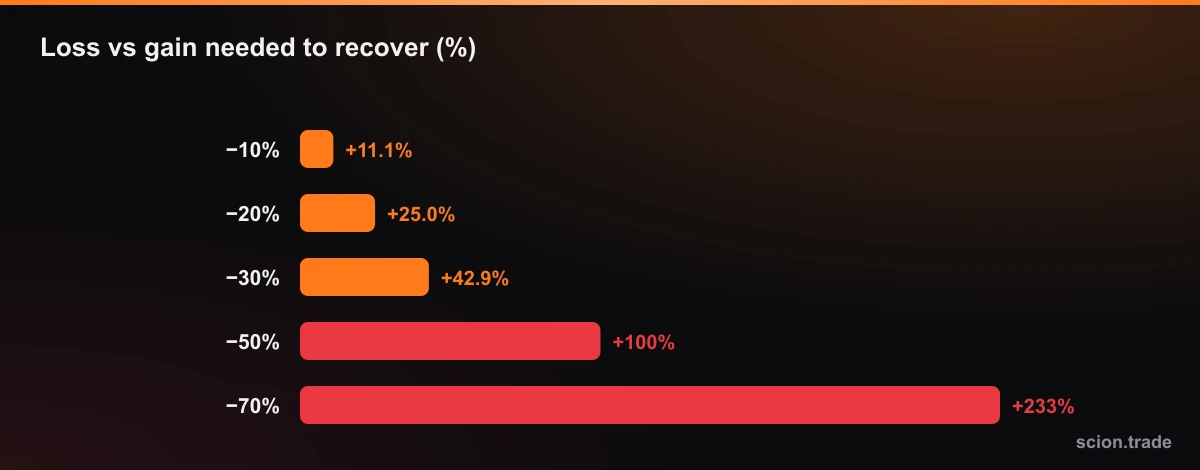
Required gain = 1 / (1 − drawdown) − 1. As losses grow, recovery grows non-linearly:
- −10% → +11.1%
- −20% → +25%
- −30% → +42.9%
- −50% → +100%
- −70% → +233%
Practical takeaways
- Set a maximum drawdown limit for your account. For example, halve position size when the account is down 10–15%.
- Leverage speeds drawdown up. At 10x a 10% move can wipe a position out; check the price in advance in the liquidation calculator.
- Cap risk per trade. The position calculator sizes a trade from the stop distance.
- Do not confuse averaging down with recovery. Adding to a position as drawdown grows can be risky.
- Separate market drawdown from account drawdown. BTC's −47% is not your account's result; your size and leverage decide that.
Sources: CryptoTicker, OKX API.
This material is for educational purposes only and is not investment advice.