Weekend liquidity: why did BTC move 7.5% on Saturday?
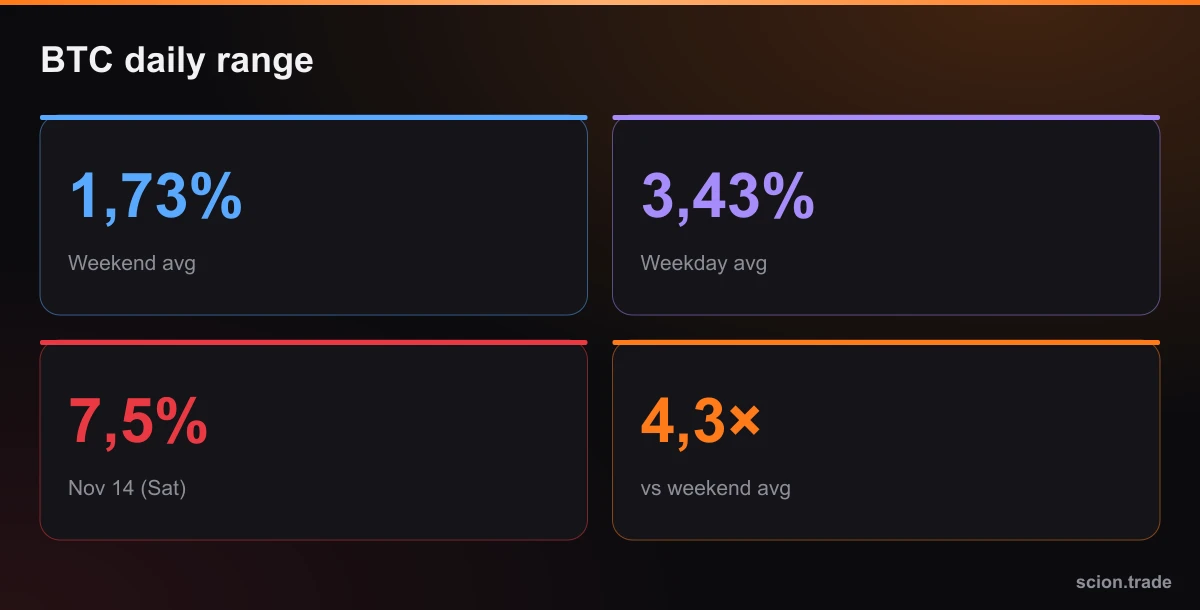
Over the last 99 days the average weekend daily range was 1.73%. On Nov 14 it was 7.5%. What is thin liquidity?
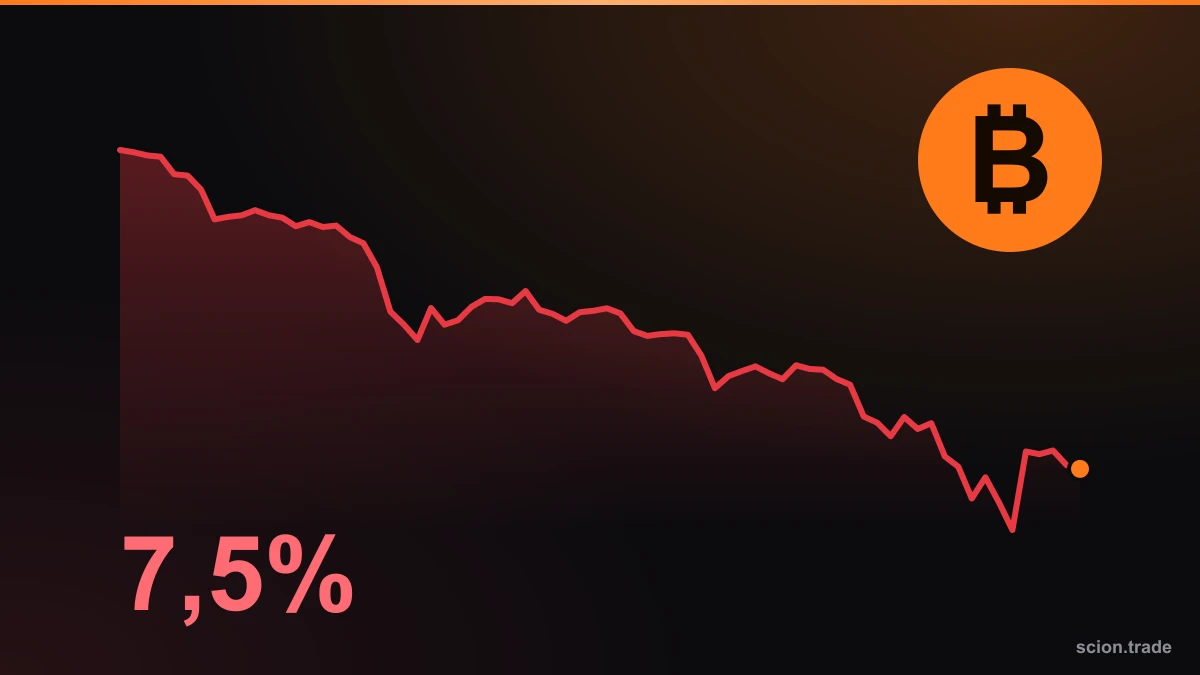
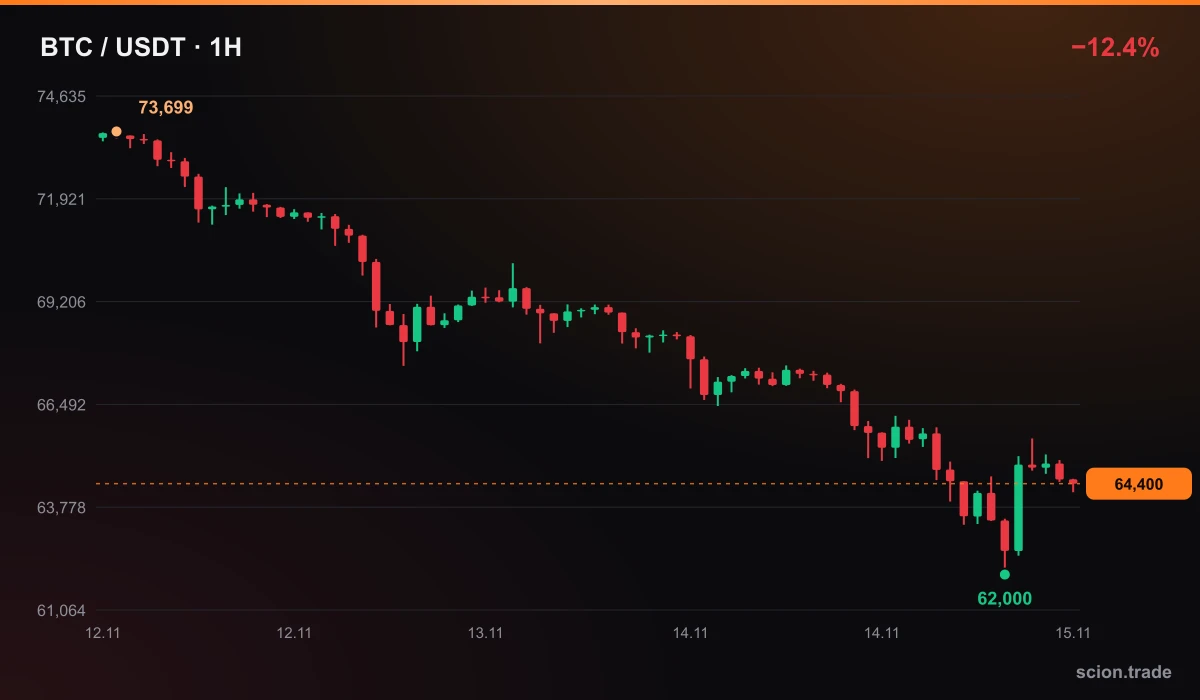
On Saturday, November 14, Bitcoin moved between $63,315 and $68,448 in a single day. That is a range of about 7.5% of the day's open. What's interesting: weekends are usually quiet. So why was this one different? The answer lies in liquidity.
The numbers: weekends are normally calm
We computed OKX daily candles (UTC) from Aug 8 to Nov 14, 99 days. Range = (day's high − day's low) / open:
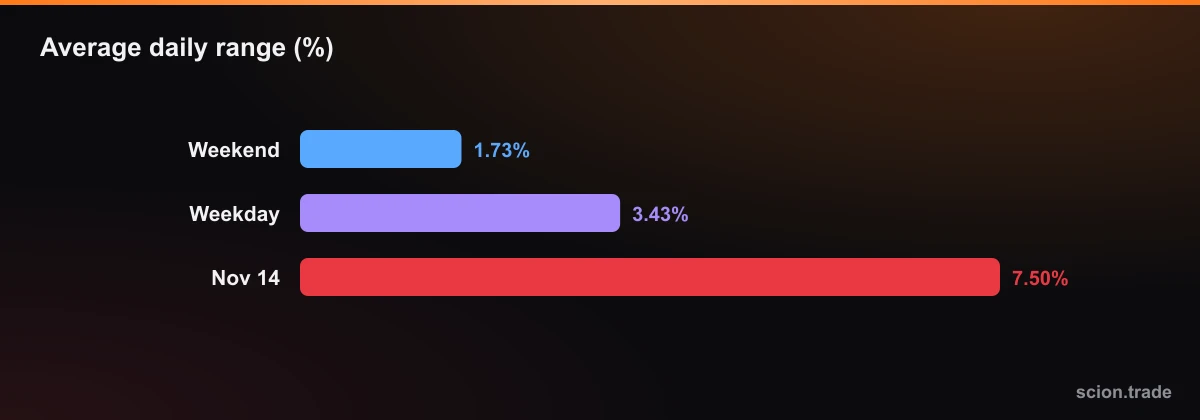
- Weekends (29 days): average range 1.73%.
- Weekdays (70 days): average range 3.43%.
- Nov 14 (Saturday): 7.5%, about 4.3 times the weekend average.
Normally price moves less on weekends because there is no macro data and no US stock market hours. But that calm can mislead: when buyers are scarce, the first strong sell is hard to absorb.
What is thin liquidity?
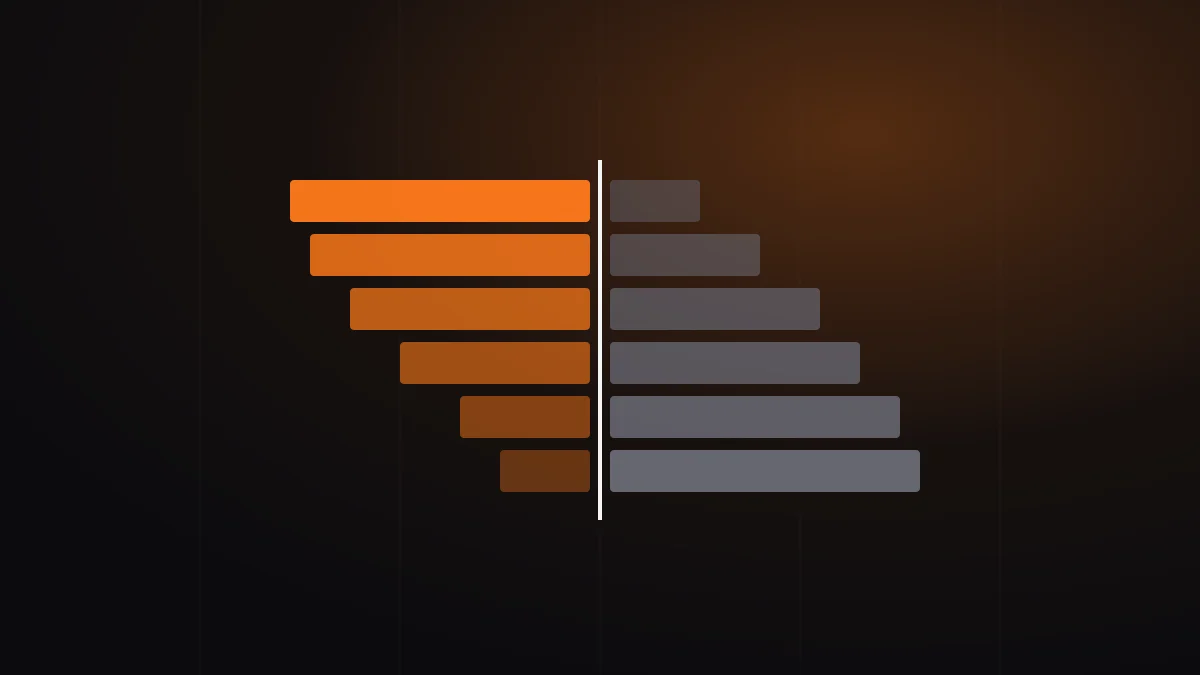
On an exchange price is set by the order book: how many buy and sell orders sit at each level. With many orders, a large market sell shifts price very little. With few, the same sell eats several levels at once. That is called slippage. See our piece on order book depth.
What happened on Nov 14
- According to CryptoTicker, $691M was liquidated in one hour as BTC broke below $64,000, 97% of it longs.
- Investing.com notes 7 straight sessions of US spot ETF outflows and broad risk reduction.
- The day before (Nov 13) price had already fallen to 68,311; on Saturday the move accelerated in a thin market.
The chain: selling → price reaches long liquidation levels → forced selling → thin order book → bigger slippage. More on liquidation cascades.
Practical rules
- Cut leverage on weekends. The same stop carries more slippage risk. Liquidation calculator.
- Use limit orders instead of market orders, especially when closing.
- Place stops well away from the liquidation price; a wick can be short but still closes the position.
- Reduce position size. Position calculator.
- Wait for the Monday open: liquidity recovers when US hours and ETF flows return.
Sources: price and candles OKX API, CryptoTicker, Investing.com. Range calculation by scion.trade.
This material is for educational purposes only and is not investment advice.