Bitcoin below $70,000: $360 million in liquidations
BTC fell below 70K for the first time since August. Causes, liquidation numbers, ETF outflows and the levels to watch.
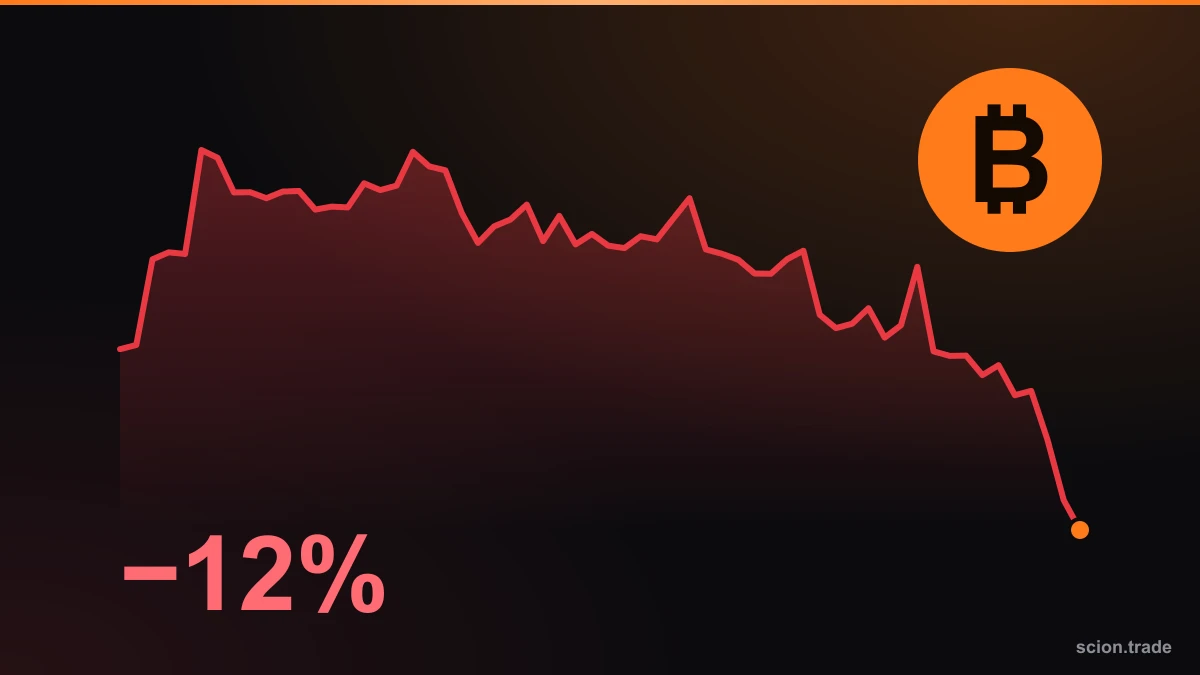
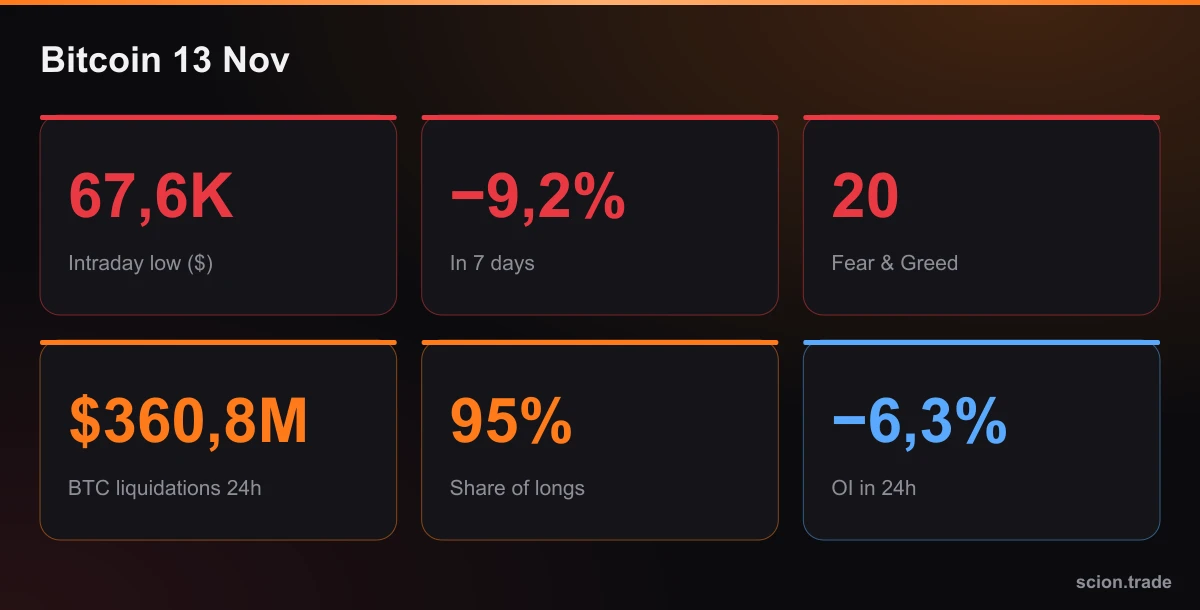
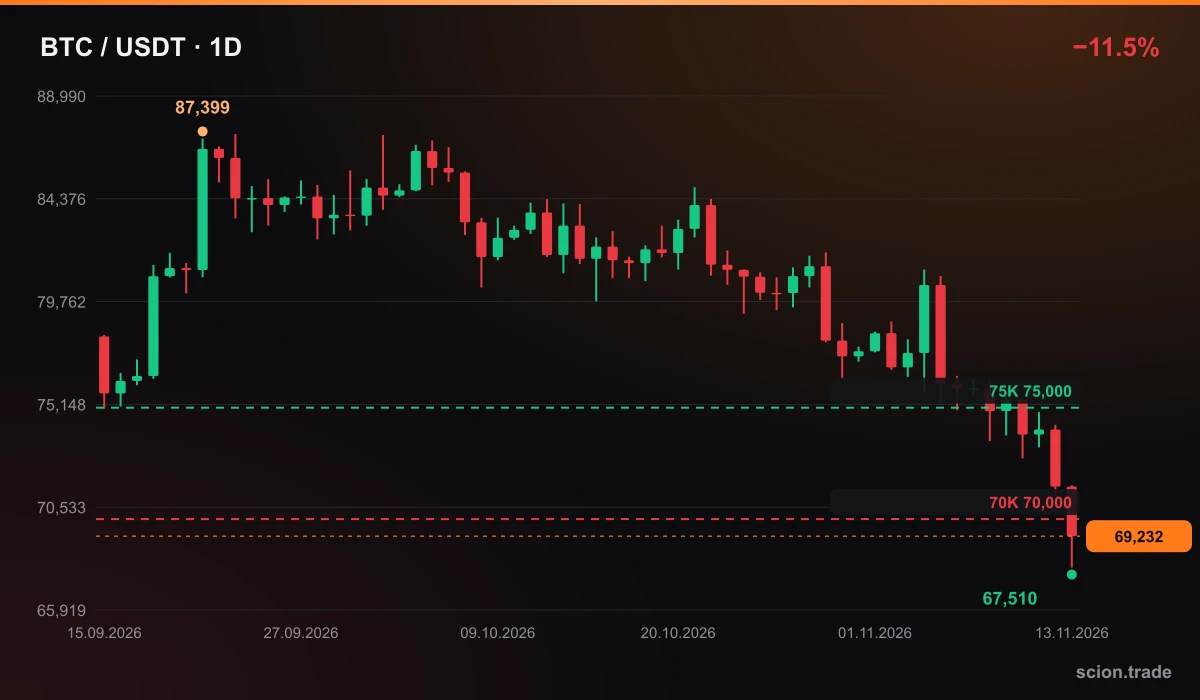
On 13 November Bitcoin fell below $70,000 for the first time since August. Bloomberg puts the intraday low at about $67,600 before the price recovered to around $69,000. The Fear & Greed Index dropped to 20.
What happened
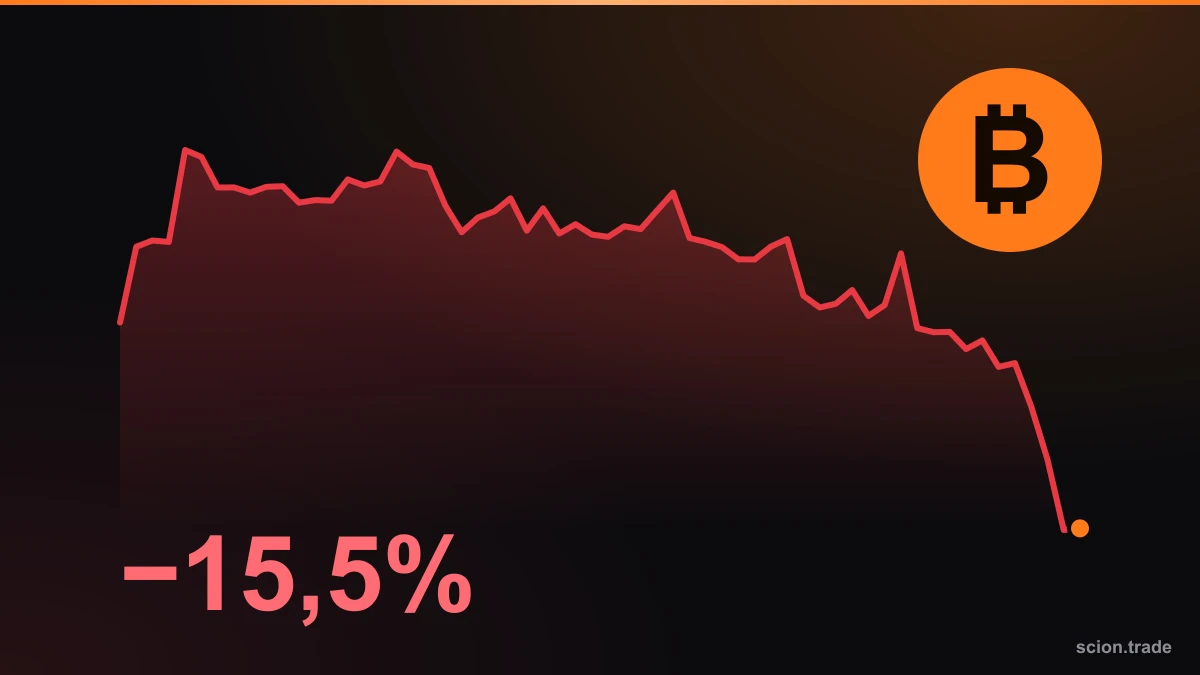
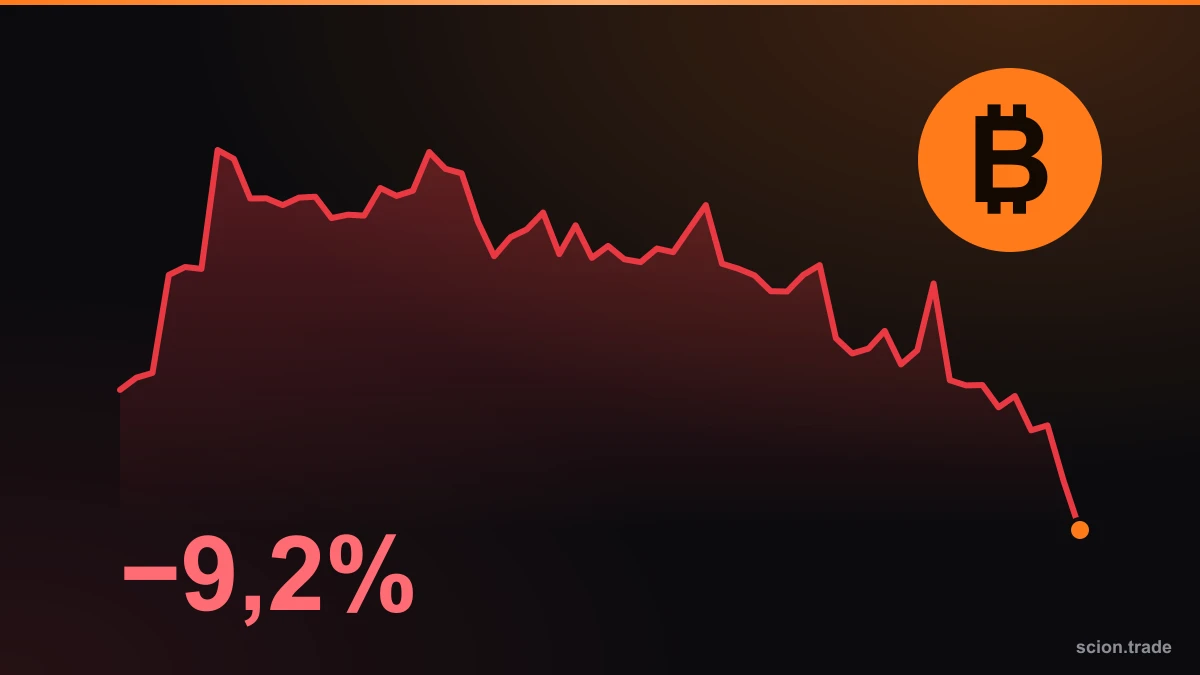
- Price: BTC fell below $70,000 on 13 November for the first time since August; Bloomberg gives an intraday low of $67,628. Cointelegraph shows a drop of about 9.2% over the week.
- Sentiment: the Fear & Greed Index fell to 20, which Cointelegraph calls its lowest reading in more than four months (last seen on 8 July).
- ETFs: BlackRock's IBIT had more than $2 billion in net outflows over nine straight sessions. Per Bloomberg, US spot Bitcoin ETFs have seen more than $2.5 billion of net outflows since 30 October.
Why it happened
According to Bloomberg, October inflation came in above forecasts (core CPI +0.3% m/m, headline +0.4%), which raises the odds of a Fed hike in December. Higher oil, a stronger dollar and volatility in tech stocks cut risk appetite. Cointelegraph, citing Talos, notes that on 9 November Bitcoin order-book depth was about 33% below normal: with thin liquidity every sale moves the price harder.
Liquidations: whose positions were closed?
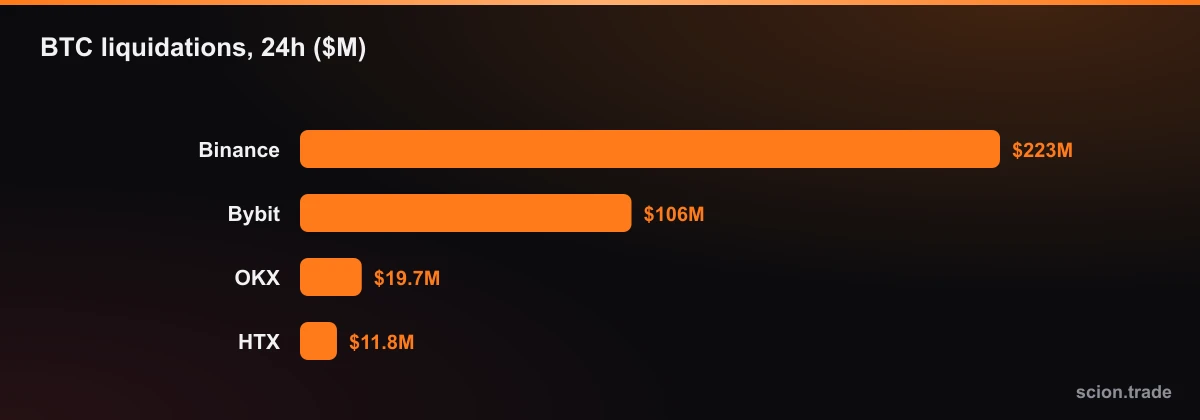
The site's data (Coinalyze · CoinBeacon) shows $360.8 million liquidated in BTC alone over 24 hours: $342.7 million of longs and $18.1 million of shorts, so roughly 95% was on the buyers' side. Binance leads with $223.4 million, Bybit follows with $105.8 million. Bloomberg reports about $1.5 billion across the whole crypto market.
Open interest fell 6.3% over the same period to $18.77 billion: the market did not only drop, it also shed leverage. On Binance, Bybit and OKX the BTCUSDT funding rate is negative, meaning shorts are paying more.
What to watch next
- The 70,000 level: former support can turn into resistance. Can price get back above it and hold?
- Funding and OI: if funding stays negative and OI keeps falling, the hurried closing may be done; a renewed rise in OI would bring fresh downside risk.
- ETF flows: whether outflows continue shows buyer fatigue.
- Macro: CPI/PPI data and rate expectations. Calendar.
To work out position size and liquidation price in advance, use the liquidation calculator.
Sources: Cointelegraph, Bloomberg / FMT, Alternative.me, price and chart from the OKX API, liquidation and OI data from the scion.trade futures panel (Coinalyze · CoinBeacon).
This material is for educational purposes only and is not investment advice.