Bitcoin slides toward $62,000: ETF outflows and $1.47B in liquidations
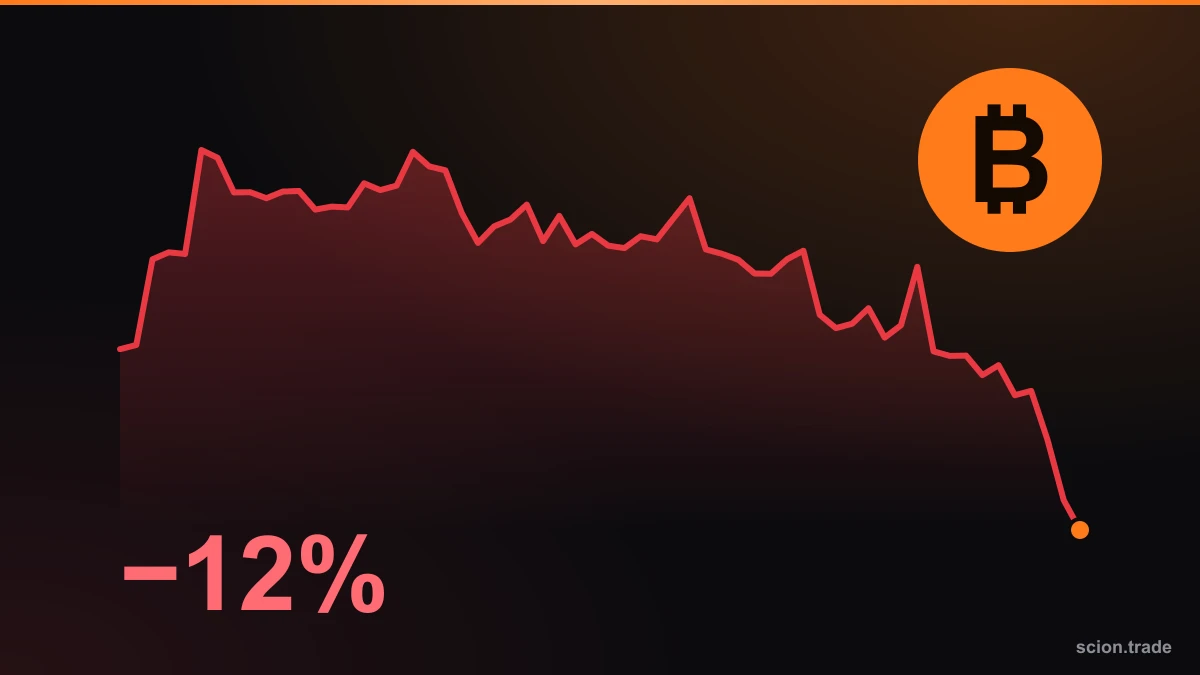
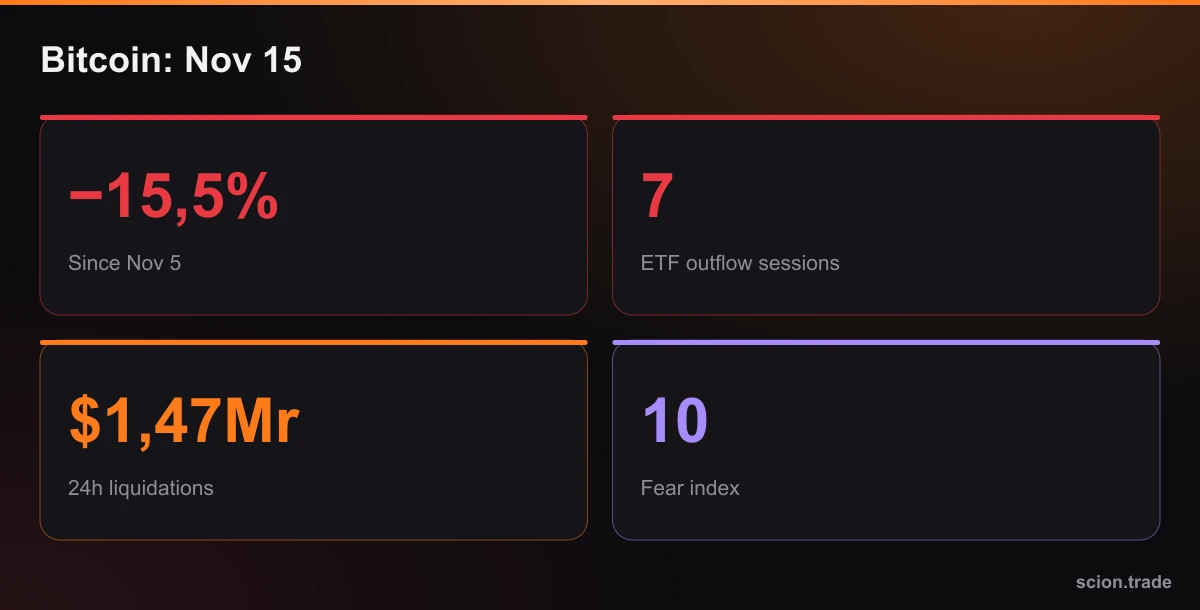
BTC is down more than 15% since Nov 5, ETFs have bled for 7 sessions and the fear index sits at 10.
Bitcoin dropped sharply on Saturday, November 14. According to OKX, the day opened at $68,312 and closed at $64,155 (−6.1%), and on Sunday morning price dipped as low as $62,000. Investing.com reports BTC is heading for a sixth straight weekly loss.
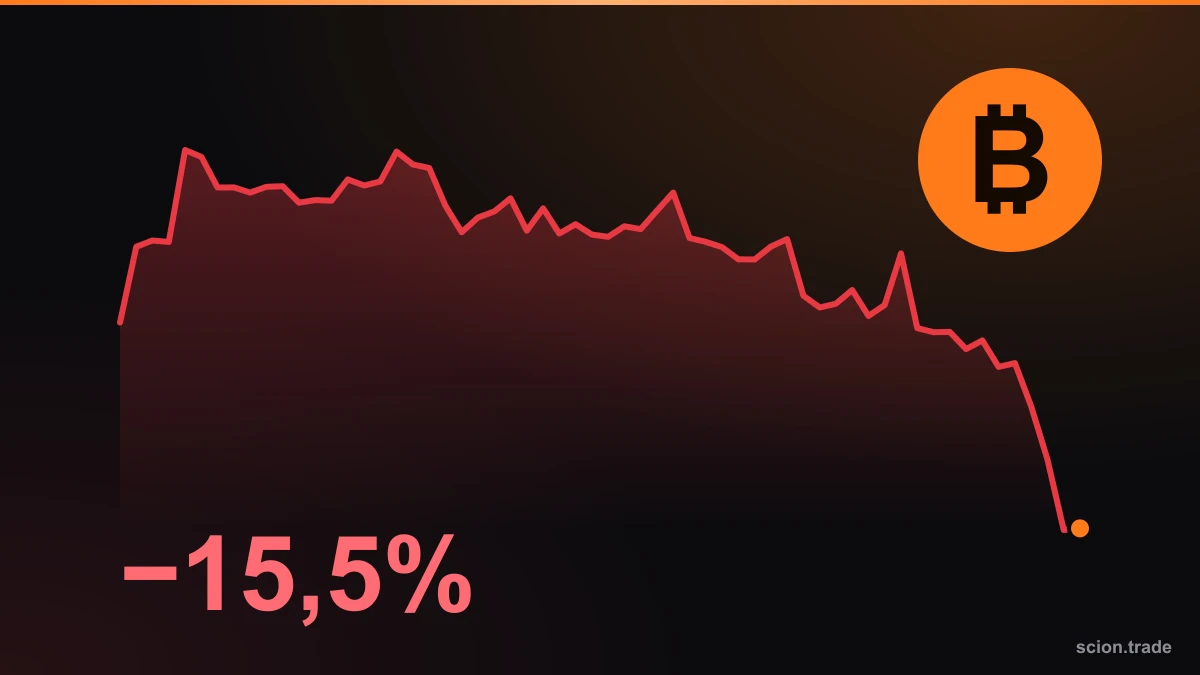
Price: −15.5% since Nov 5
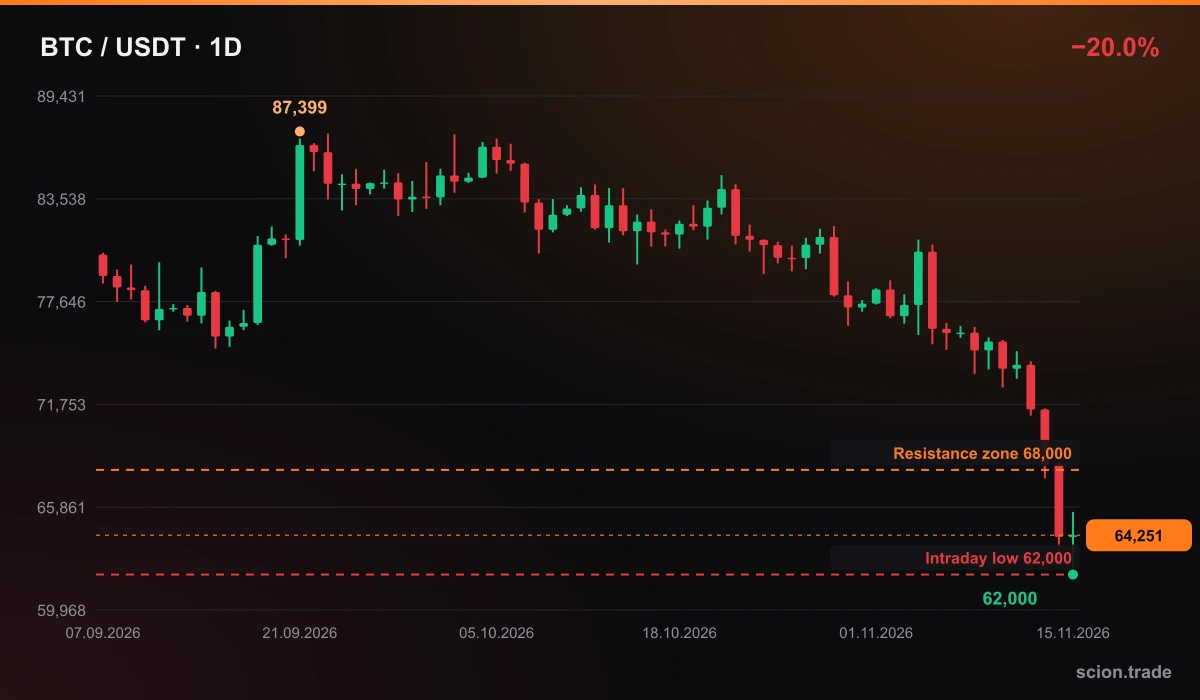
The Nov 5 close was $76,087 (OKX). Price is now around $64,300, roughly −15.5%. Levels on the chart: 62,000 (latest intraday low), 60,000 (psychological) and the 66,000–68,000 zone above, where former support may now act as resistance.
ETF outflows: 7 sessions in a row
Per SoSoValue, US spot Bitcoin ETFs saw $185.45M of net outflows on Friday. That is the seventh straight outflow session; cumulative outflows since Nov 5 are about $1.91B. ETF outflows are direct selling pressure: when funds pay investors out, BTC gets sold.
Liquidations: $1.47B
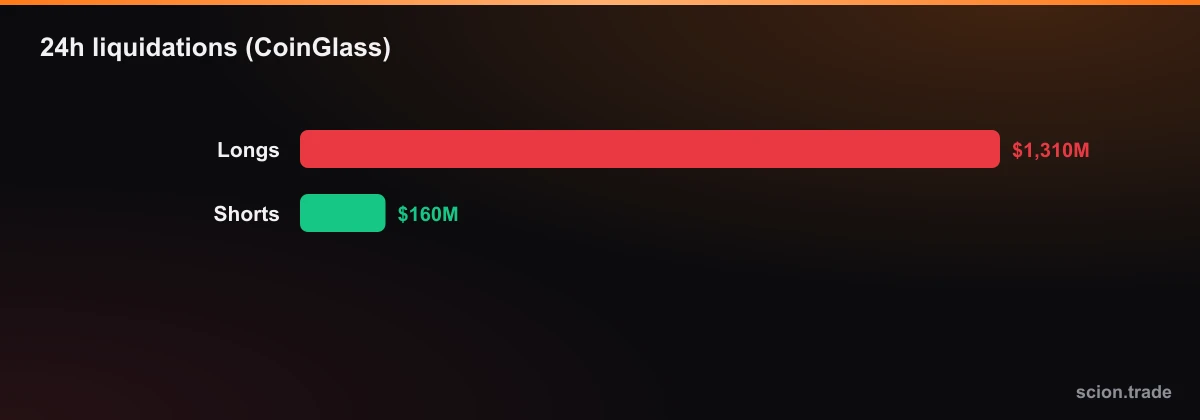
CoinGlass shows $1.47B liquidated across crypto in 24 hours, of which $1.31B were longs (about 89%). CryptoTicker reports $691M liquidated in a single hour as BTC broke $64,000, 97% of it longs.
How it works: when the margin of a leveraged position runs out, the exchange closes it by force. Closing a long means a market sell, which pushes price lower and closes the next positions. This is a liquidation cascade. On the scion.trade futures panel, BTC open interest is $17.12B, down 3.9% in 24 hours: leverage is being flushed, but the process isn't over.
Fear index: 10
According to alternative.me the Fear & Greed index is 10 today (Extreme Fear). It was 28 on Nov 12, 20 on Nov 13 and 13 on Nov 14. The macro backdrop is heavy too: CME FedWatch puts the odds of a December rate hike at about 88.5%.
Practical takeaways
- Don't try to call the bottom. Extreme fear sometimes sits near a reversal, but during a cascade price can overshoot.
- Cut leverage. At 10x a move of about 10% against you wipes the margin, and weekend liquidity is already thin. Liquidation calculator.
- Calculate stop and position size in advance. Position calculator.
- Watch: ETF flows (do outflows continue?), falling OI, the 62,000 and 60,000 levels, and whether the 66,000–68,000 zone is reclaimed.
Sources: price OKX API, OI scion.trade futures panel, ETF and liquidations Investing.com (SoSoValue, CoinGlass), CryptoTicker, fear index alternative.me.
This material is for educational purposes only and is not investment advice.