What is a bond yield? How the 10-year at 4.98% hits gold and Bitcoin
A plain explanation of bond yields with the 10 November example: how the dollar, gold, stocks and Bitcoin reacted in a single day.
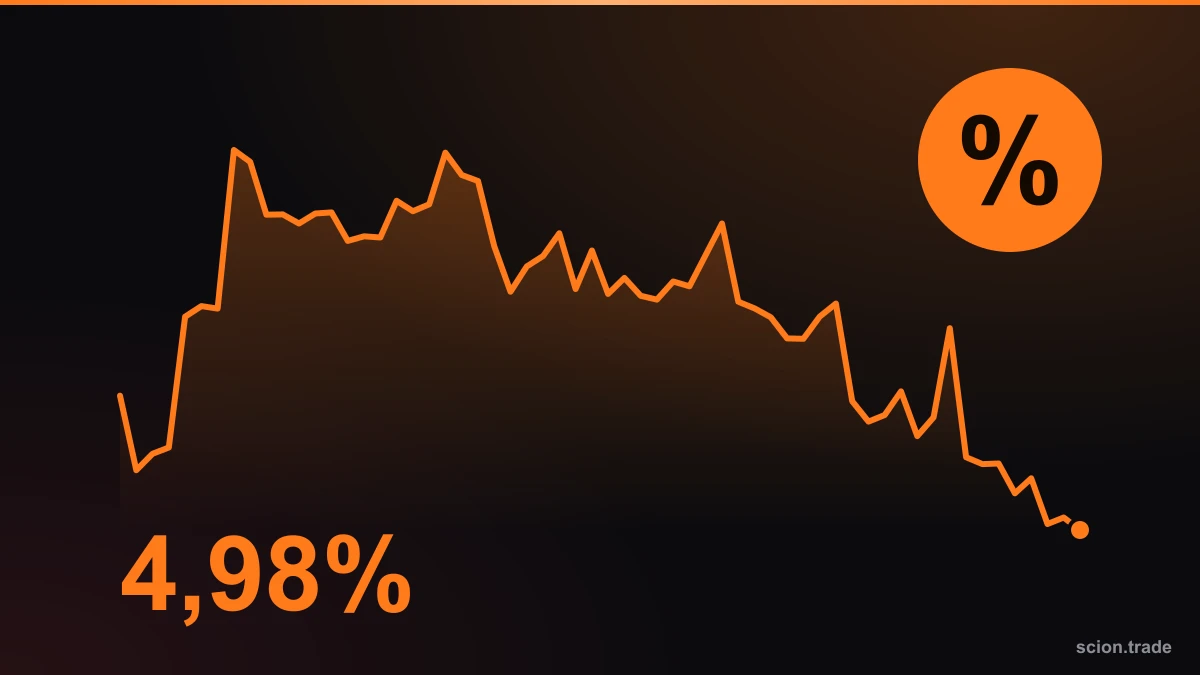
On 10 November the headlines kept saying "the 10-year yield neared 5%." What does that mean, and why do gold, stocks and Bitcoin come under pressure on the same day? This article explains bond yields using today's numbers.
What is a bond yield?
A government bond is an IOU from the government: you lend the money, get it back after a set period and receive interest in the meantime. The yield is the annual return relative to the bond's current price.
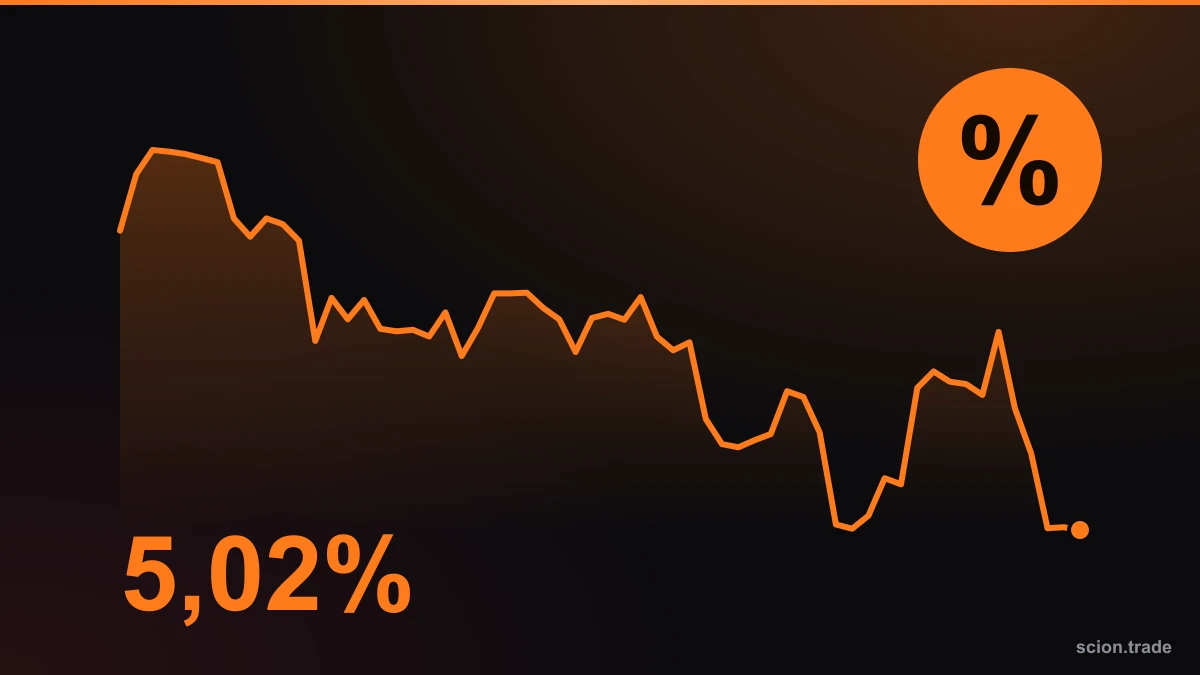
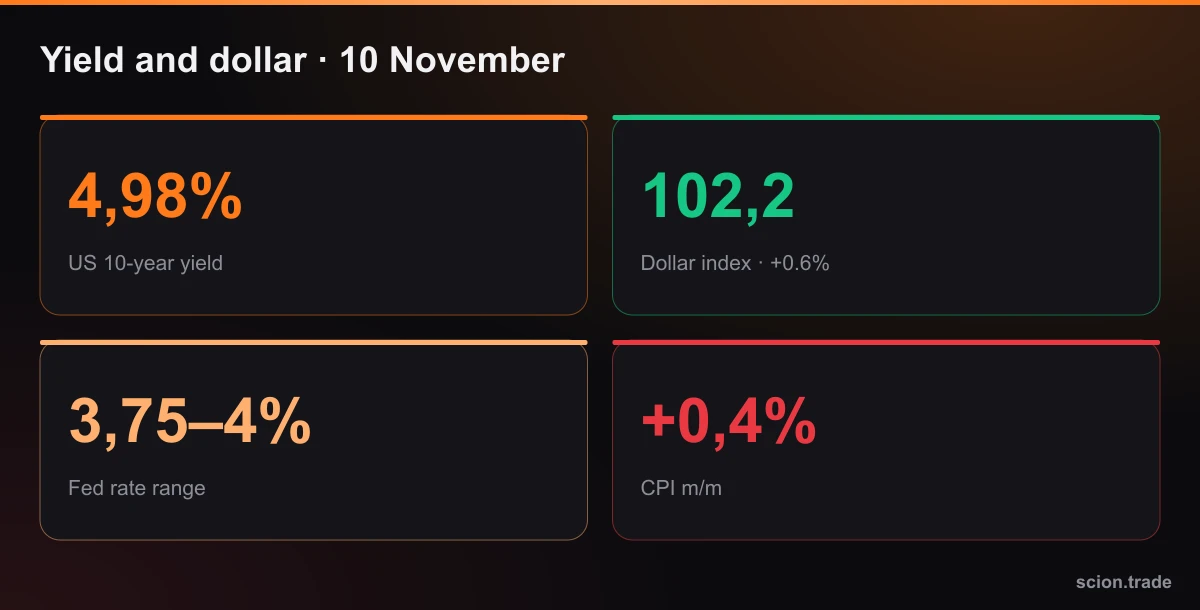
The key rule is simple: when a bond's price falls, its yield rises, and vice versa. The US 10-year yield is the world's main benchmark for the "risk-free rate." On 10 November it reached about 4.98% (a 2.45% relative jump in one session). The Fed's current policy range is 3.75–4%.
Why it matters so much
- Alternative return. If you can earn ~5% risk-free, the appeal of assets such as gold (no interest) or crypto shrinks.
- Cost of funding. Higher yields make debt more expensive for companies, governments and leveraged markets.
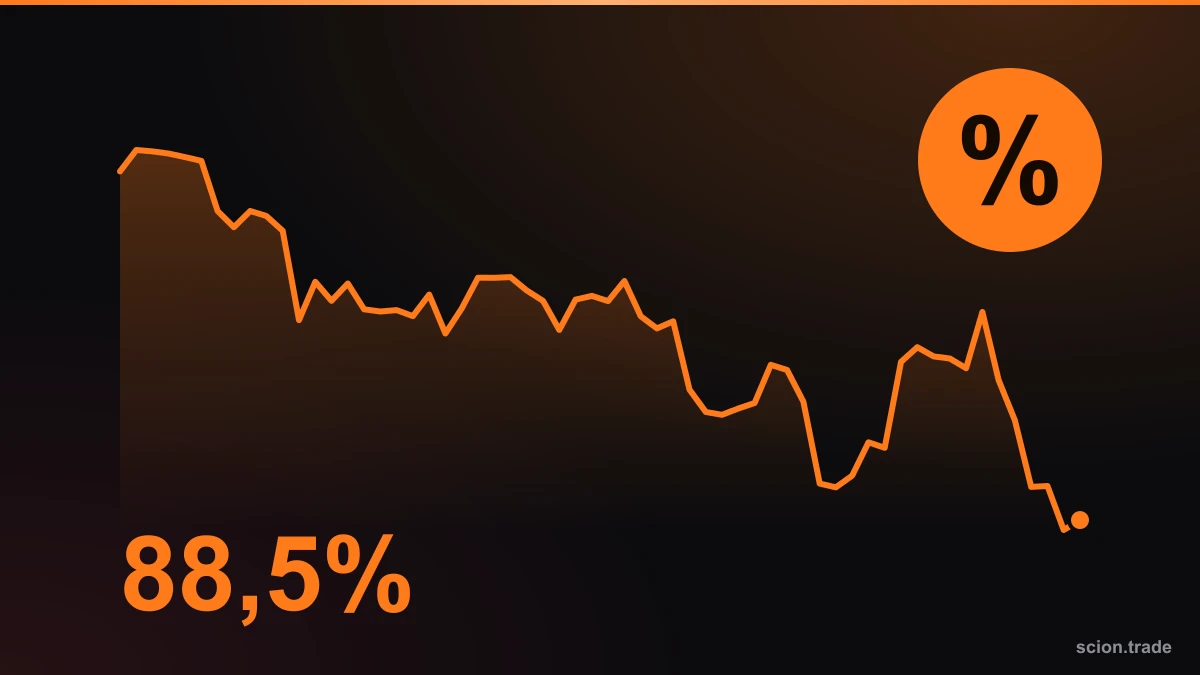
- The dollar. Higher US yields raise demand for dollars; the dollar index rose to about 102.2 (+0.6%) on 10 November.
This week's example
October CPI rose 0.4% m/m (forecast 0.3%). Markets began to expect a Fed hike in December, yields rose, and assets reacted in a single day like this:
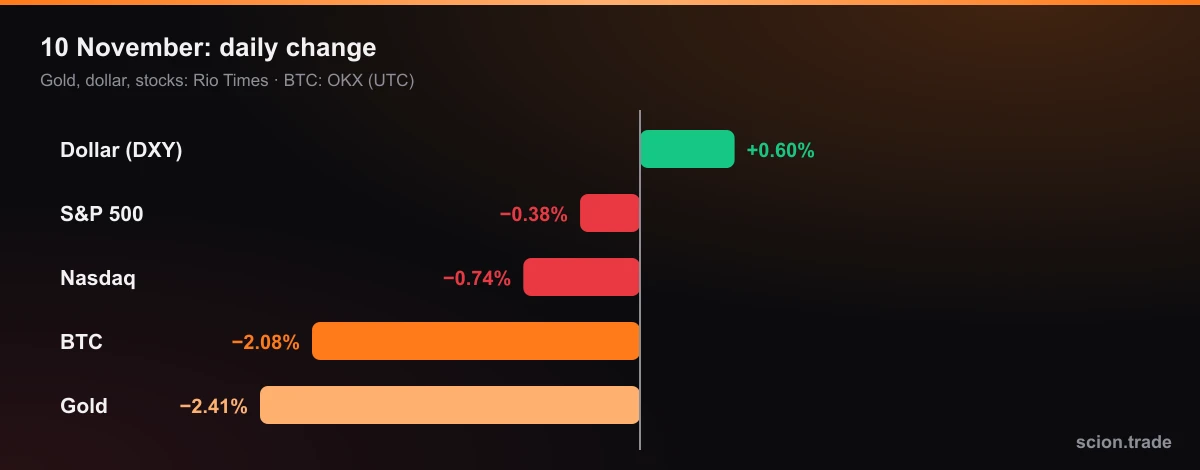
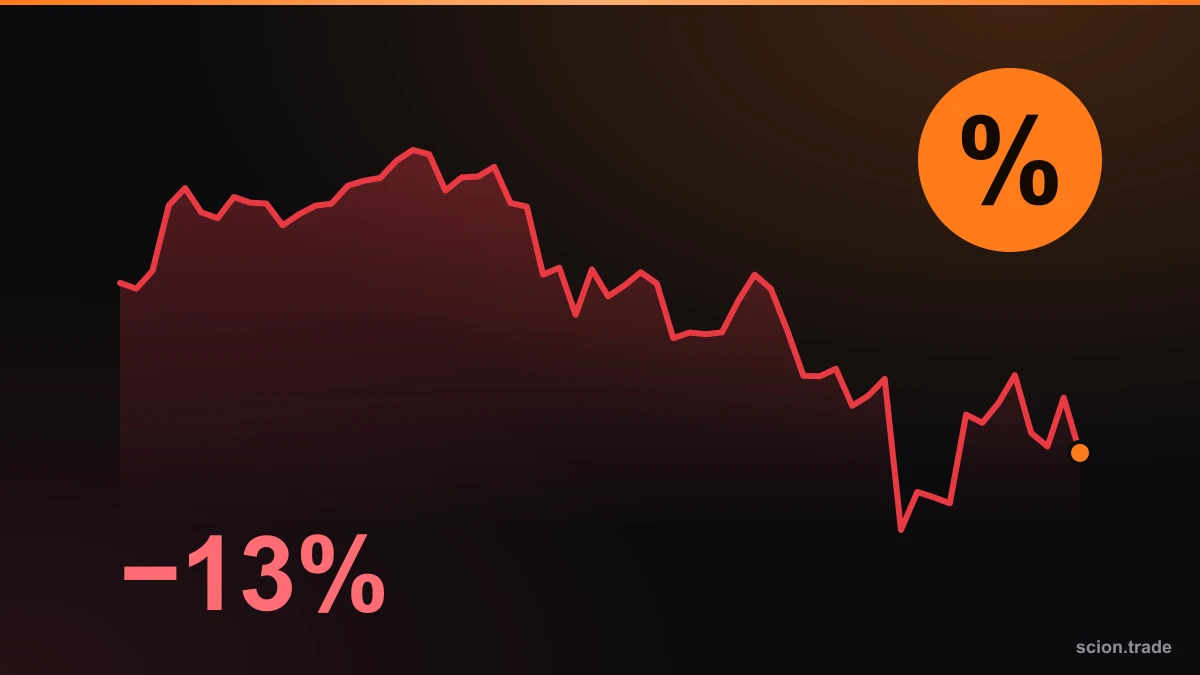
- Gold: about −2.4% (a no-yield asset; the dollar and yields rose).
- Bitcoin: −2.1% (OKX daily candle, UTC).
- Nasdaq: −0.74%, S&P 500: −0.38%; tech stocks are more sensitive to long-term yields.
- Dollar index: +0.6%.
A simple working scheme
- Yield ↑ + dollar ↑ → gold ↓, usually crypto and growth stocks ↓
- Yield ↓ + dollar ↓ → gold ↑, a softer backdrop for risk assets
These rules do not work every day: sometimes news, ETF flows or crowded positioning dominate. For example, on 9 November stocks rose as oil fell, while Bitcoin stayed flat.
Practical tips
- On macro-news days (CPI, PPI, Fed) reduce position size. Position calculator.
- Watch the 10-year yield and the dollar index on the markets page; they can give an early hint of asset direction.
- PPI is due on Friday: economic calendar.
Sources: yield, dollar index and price changes Rio Times, CPI and Fed CNBC, BTC change from OKX daily candles (UTC).
This material is for educational purposes only and is not investment advice.