Fear & Greed Index at 28: what it says and what it does not
What the index is made of, what the last 30 days show and why the fear zone is not a "bottom" signal. Practical rules for using it.
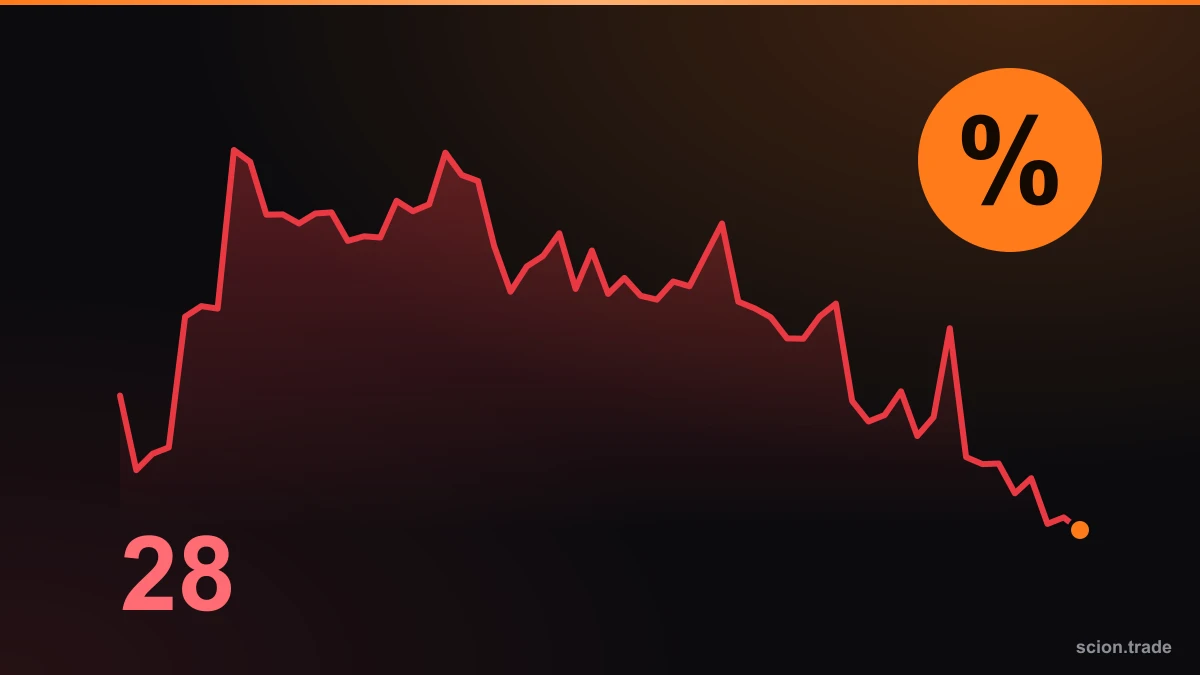
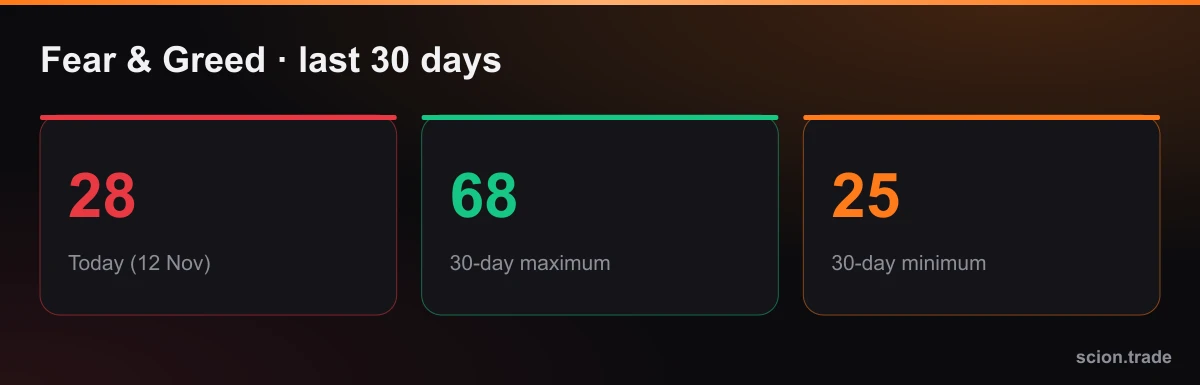
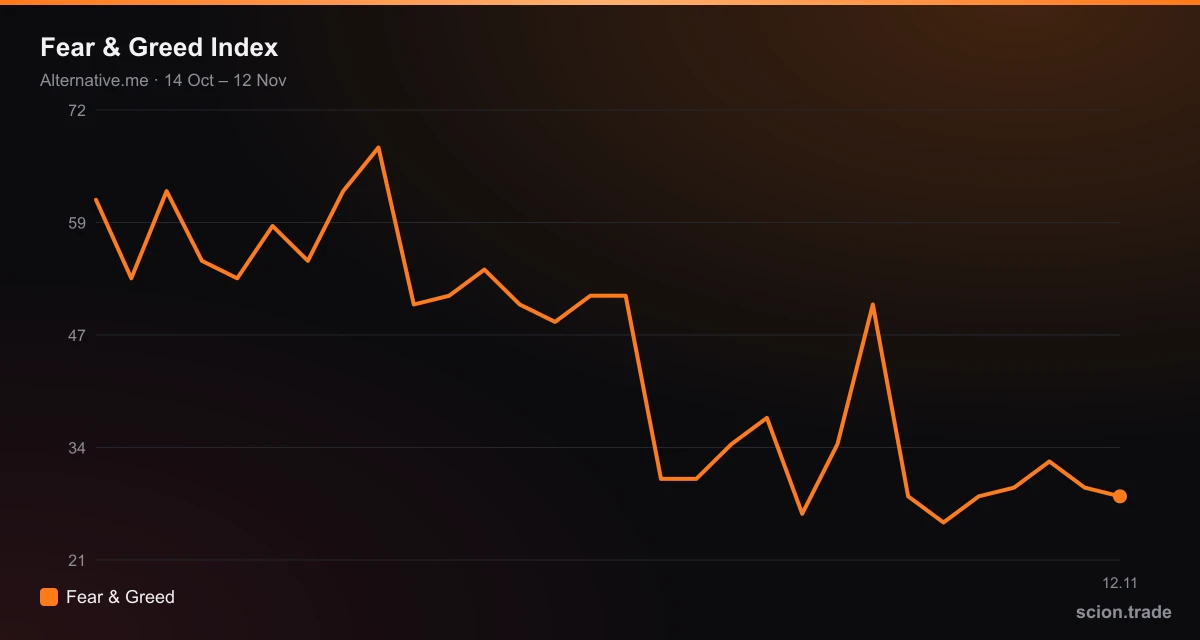
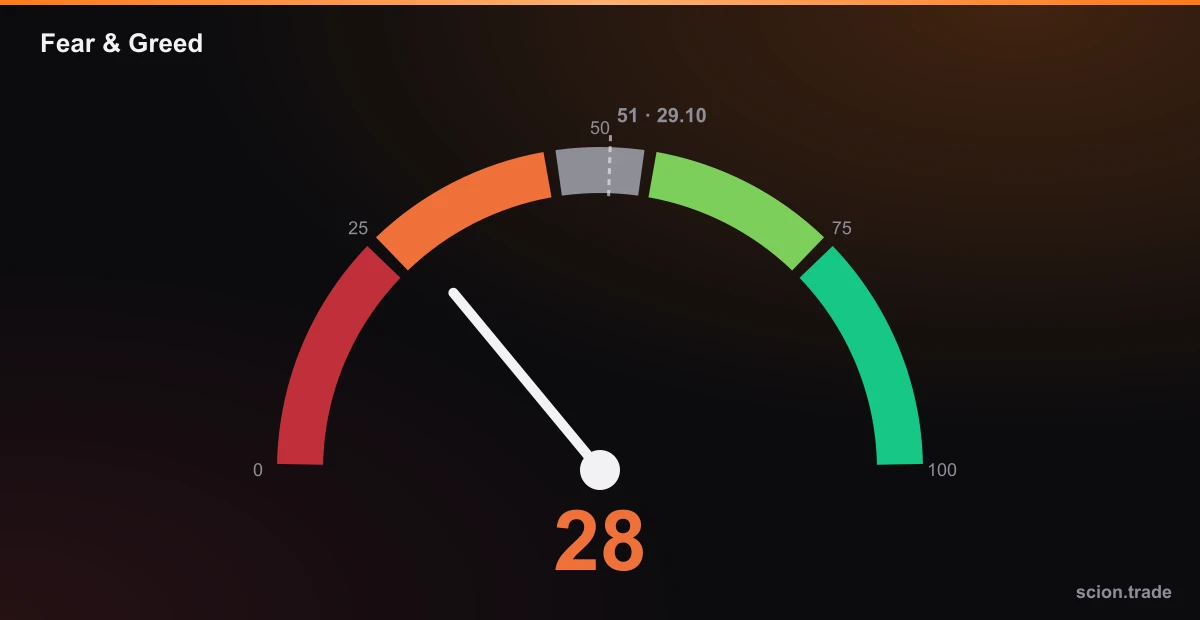
The crypto Fear & Greed Index shows 28 today, which is "fear" territory. More important, the index has stayed low almost continuously since 29 October: it was below 40 on 13 of the last 14 days.
What goes into the index?
Alternative.me builds the index from several components: volatility, market momentum and volume, social media, Bitcoin dominance and Google Trends. So it looks at people's behavior, not only at price.
What the last 30 days show
- Maximum: 68 (22 October), minimum: 25 (7 November).
- From 51 on 29 October to 30 on 30 October: a sharp drop.
- A brief jump to 50 came on 5 November, and the next day it was back at 28.
- The average over the last 14 days is about 31.
What the fear zone does not mean
- It is not "the bottom." Fear can last; the index can sit between 25 and 35 for weeks.
- It is not a "buy" signal. The contrarian view ("when others are fearful…") is a way of thinking, not an entry rule on its own.
- It is a lagging indicator. The index reflects moves that already happened, not the future.
Today's context
CoinDesk reports that on 11 November ETF outflows reached a fourth day, longs were liquidated in derivatives, and funding is below its usual level. That fits the reading: the market is cautious but not in panic (extreme fear) territory.
How to use the index
- As an extra filter: read it together with technical levels, funding and OI. About funding and OI.
- Risk management: volatility is high in fear zones; use a stop-loss and a small position size.
- Check your emotions: when the index shows heavy fear, ask whether fear is driving your own decisions.
Sources: index data from the Alternative.me API (last 30 days), derivatives and flows context CoinDesk.
This material is for educational purposes only and is not investment advice.