Why is Bitcoin falling? 5 reasons behind the November 2026 sell-off and the levels to watch
BTC is 41% below its all-time high and 14.6% below its September peak. ETF outflows, post-election regulatory worries, a Nasdaq sell-off, rate expectations and liquidations: the reasons in numbers, the key levels and this week's calendar.
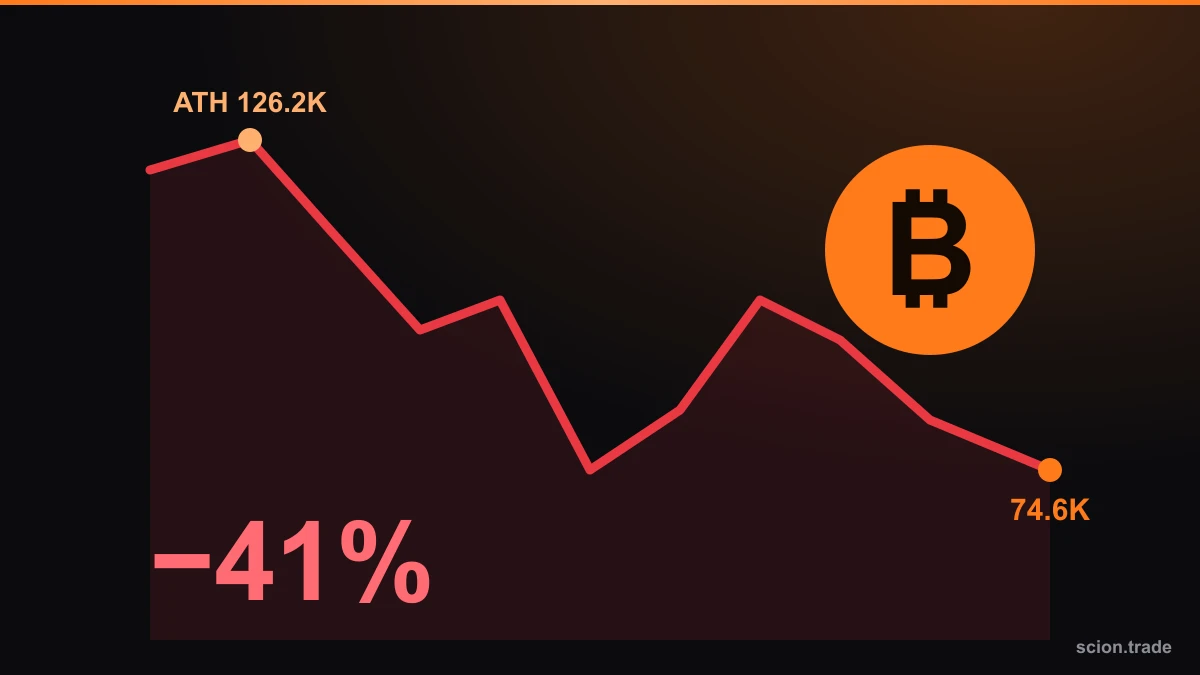
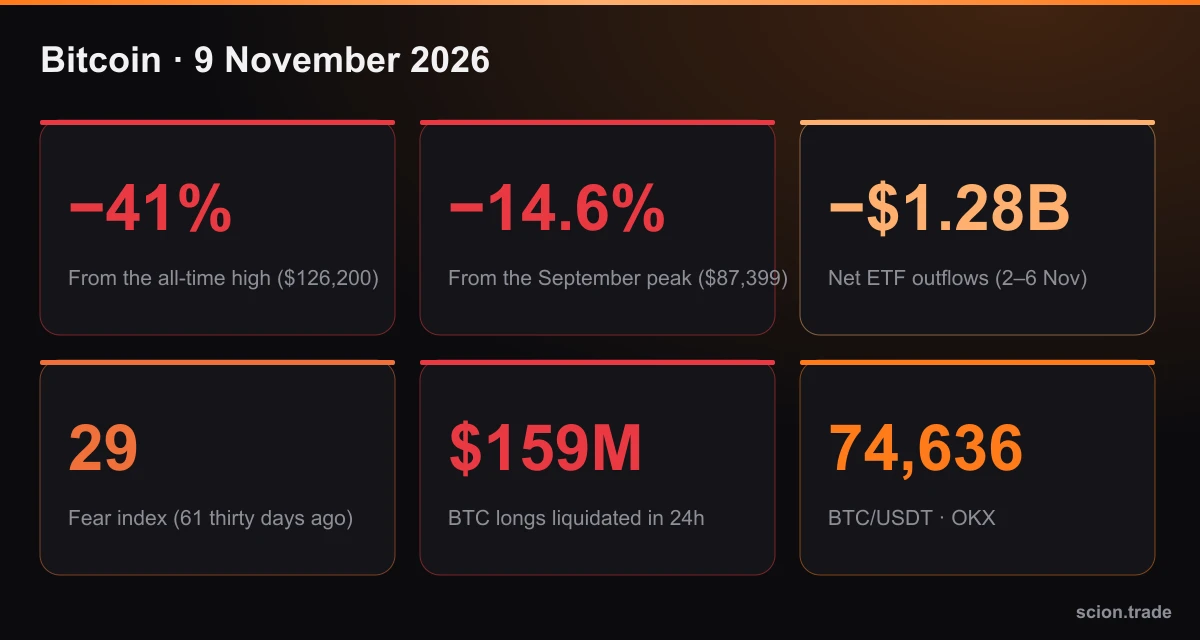
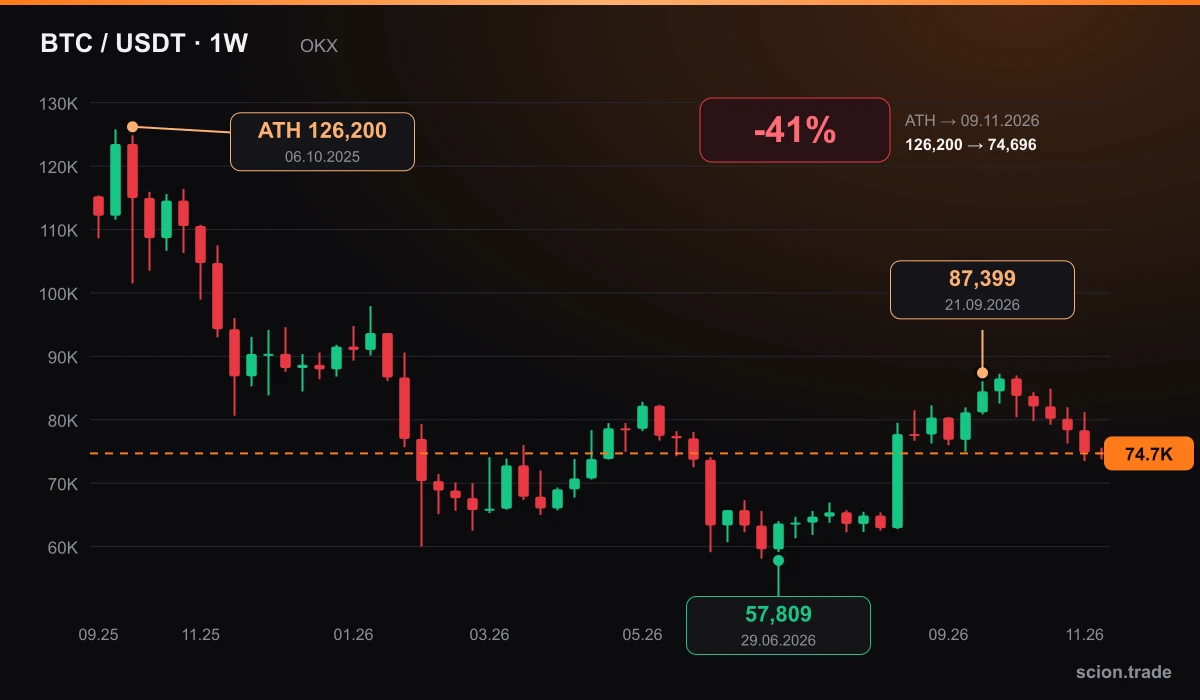
Bitcoin fell as low as $73,500 on 9 November 2026, its lowest level since August. At the time of writing BTC trades around $74,600. That is 41% below the $126,200 all-time high of 6 October 2025 and 14.6% below the $87,399 rebound peak of 21 September 2026.
The big picture: from the top to today
To understand this drop, look at the past year. The weekly chart has three key points:
- 6 October 2025 – $126,200: Bitcoin's all-time high.
- Week of 29 June 2026 – $57,809: the bottom of the long decline. From February to July the price was stuck in a $60–75K range.
- 21 September 2026 – $87,399: the top of a rebound of roughly 50% from the low.
Since September the price has made lower highs every week, a sign that the upward move is losing strength.
5 reasons for the drop
1. US elections and regulatory risk
Democrats won the 3 November midterms. Elizabeth Warren, known for her sceptical stance on crypto, is expected to chair the Senate Banking Committee. The market is pricing in a slowdown of the crypto-friendly legislation of the past two years and possibly tighter rules.
2. Outflows from spot Bitcoin ETFs
US spot Bitcoin ETFs saw about $1.28 billion in net outflows in the week of 2–6 November, the largest weekly outflow since June 2025. ETFs have been one of the biggest buyers of the past two years; when that buyer turns seller, the price loses support.
3. Tech and AI stock sell-off
The Nasdaq fell 5.5% on the Thursday after the elections, extending a four-week losing streak. Bitcoin's 30-day correlation with the Nasdaq 100 is around 0.80, so BTC is currently trading like a "risk asset" alongside stocks. Negative headlines around Nvidia and US–Iran talks that went nowhere added pressure over the weekend.
4. Inflation and rate expectations
After strong jobs data, markets are pricing roughly an 80% chance of a 25-basis-point Fed rate hike in December. October inflation (CPI), due on 10 November, is expected to rise from 3.7% to 3.9%, and oil's roughly 15% rise in October adds upside risk. Risk assets such as Bitcoin usually struggle when rates are rising.
5. Leverage flush: liquidations
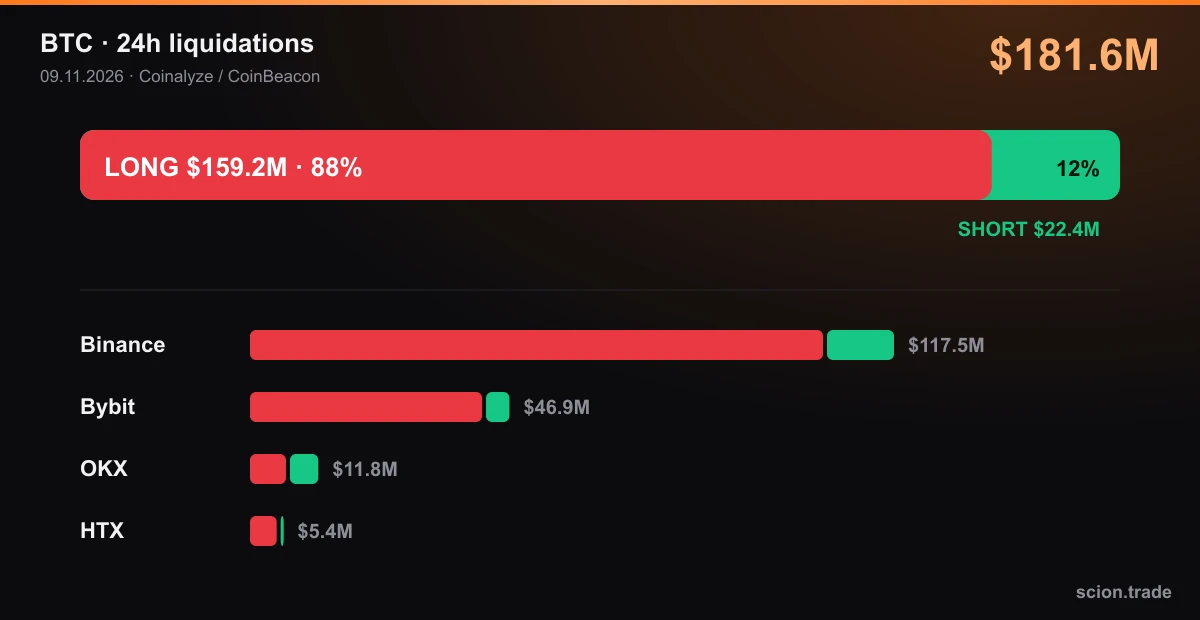
As the price fell, leveraged long positions were force-closed, and that selling sped up the decline. In the last 24 hours $181.6 million of Bitcoin positions alone were liquidated, 88% of them longs. Across the whole crypto market, liquidations topped $1 billion.
Market sentiment: fear
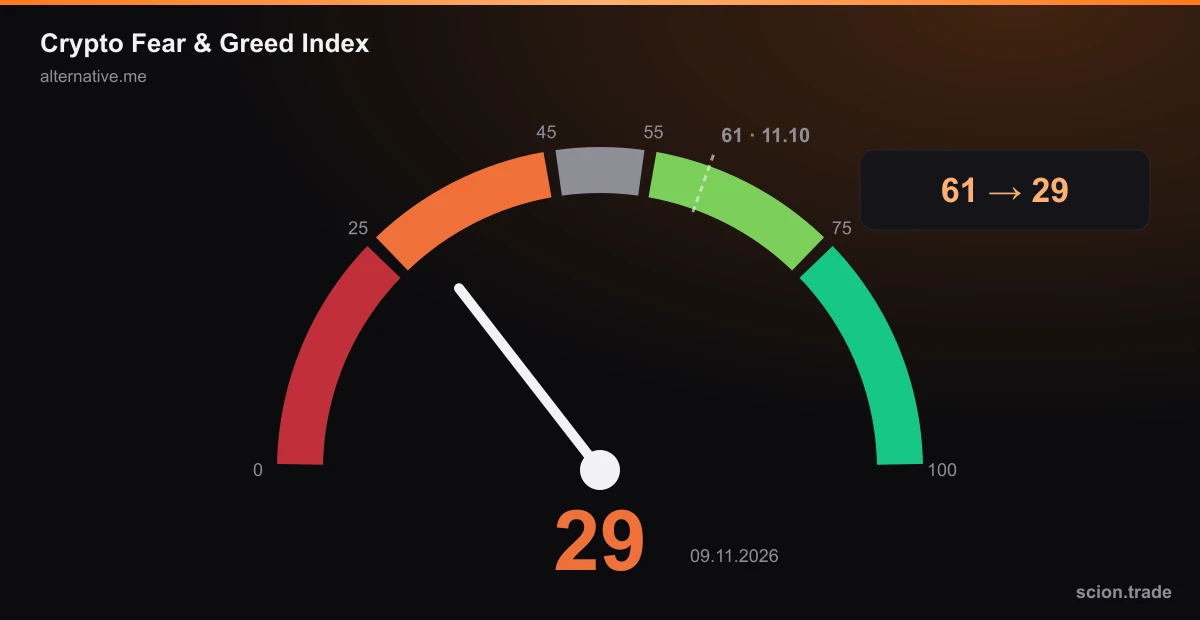
The Crypto Fear & Greed Index was at 61 (greed) a month ago and is 29 (fear) today. Last week it briefly dropped to 25, in "extreme fear". Extreme-fear periods have sometimes lined up with market bottoms, but on its own that is not a buy signal.
Funding rates are around 0.01% on most exchanges, which is neutral. Open interest fell 1.8% in 24 hours to about $20.2 billion, showing that part of the leverage has already been flushed out.
Key levels to watch
The price is sitting between two important averages: the 200-day average (~$73,200) is acting as support and the 100-day average (~$77,460) as resistance.
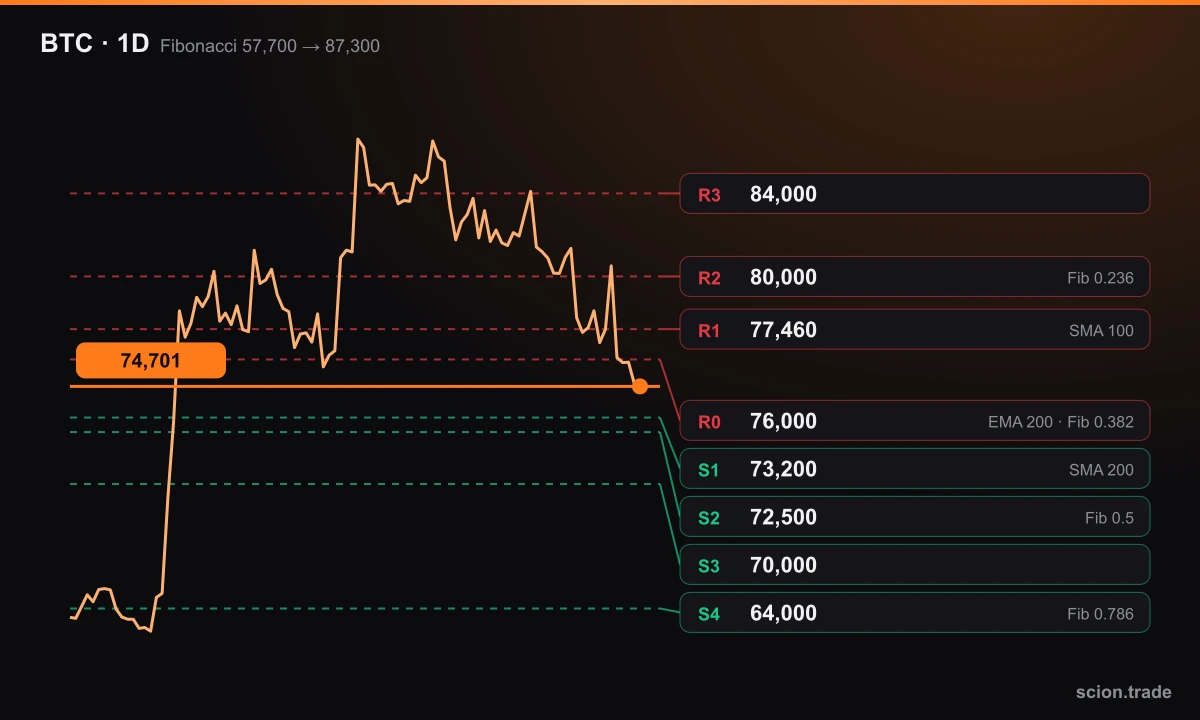
Supports:
- $73,200: 200-day average.
- $72,500: 50% Fibonacci retracement of the 57,700 → 87,300 move.
- $70,000: psychological level.
- $64,000: 78.6% Fibonacci retracement.
Resistances:
- $76,000: 200 EMA and 38.2% Fibonacci.
- $77,460: 100-day average.
- $80,000: 23.6% Fibonacci and a psychological level.
- $84,000: key resistance tested in mid-October.
Daily closes below $72,500 could bring a test of $70,000. Holding above $77,500 would be the first sign that the selling pressure is easing. Technical levels are not guarantees and should not be the only basis for a decision.
What to watch this week
- Tuesday, 10 November – US CPI (October): a hotter-than-expected print would strengthen rate-hike expectations.
- US PPI: the second key data point for rate expectations.
- ETF flows: whether outflows continue or turn into inflows.
- Nasdaq and AI stocks: CoreWeave and Nebius earnings.
See every release time in your own time zone in our economic calendar.
What to keep in mind in times like these
- Lower your leverage. In volatile markets high leverage can knock you out even when your direction is right.
- Limit the risk on each trade. Don't risk more than 1–2% of your balance on a single trade. Size your position with our risk calculator.
- Never open a trade without a stop. Set your stop using support, resistance and your liquidation price.
- Be careful around news. When data like CPI comes out, the price can swing sharply both ways within seconds.
- Don't trade on emotion. Panic-selling in fear and going all-in to "buy the bottom" are equally risky.
Sources: price data OKX (BTC-USDT); liquidations, funding and open interest Coinalyze and CoinBeacon; fear index Alternative.me; news and expectations FXStreet and CoinDesk.
This material is for educational purposes only and is not investment advice.